Results-Driven Accountability for Education: Insights from the RDA Conference 2013
This presentation from the Results-Driven Accountability (RDA) State Directors Conference in Boise, ID, on March 4, 2013, led by Cesar D’Agord, outlines the impacts of RDA on state performance and school districts. It delves into the implications of OSEP guidelines on the education of children with disabilities, emphasizing accountability, compliance, and the use of data to enhance educational outcomes. Key monitoring priorities and the determination process for state performance are discussed, critical for ensuring free appropriate public education in the least restrictive environment.

Results-Driven Accountability for Education: Insights from the RDA Conference 2013
E N D
Presentation Transcript
Results-Driven Accountability (RDA) State Directors Conference Boise, ID, March 4, 2013 Cesar D’Agord Regional Resource Center Program WRRC – Western Region
RDA… • What do we know about RDA? • How is RDA likely to impact your State? • How will it possibly impact your School district? “ The opinions and information expressed in this presentation do not necessarily reflect the position or policy of the Office of Special Education Programs (OSEP) or the United States Department of Education (USDOE). No endorsement of OSEP or USDOE should be inferred."
Data Sources for this Presentation: • A presentation prepared by OSEP, delivered nationally to all states via webinar on August 27, 2012 • OSEP’s Memo 13-6, distributed to states on December 12, 2012 (12/12/12) • IDEA Section 618 Report to Congress data • National Center on Educational Outcomes (NCEO) materials • WRRC materials and data calculations • IDEA 2004
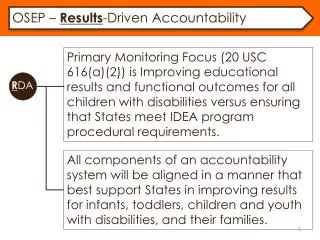
The primary focus of Federal and State monitoring activities shall be on- • improving educational results and functional outcomes for all children with disabilities • ensuring that States meet… the program requirements, with… emphasis on those most related to improving results 20 U.S.C. 1416(a)(2) Sec. 616(a)
Monitoring Priorities The Secretary shall monitor the States, and shall require each State to monitor the local educational agencies…using quantifiable indicators in each of the following priority areas…: Sec. 616(a)
Monitoring Priorities (A) Provision of a free appropriate public education in the least restrictive environment. (B) State exercise of general supervisory authority, including child find, effective monitoring, the use of resolution sessions, mediation,…and a system of transition services. (C) Disproportionate representation of racial and ethnic groups in special education and related services to the extent the representation is the result of inappropriate identification. The Secretary shall consider other relevant information and data, including data provided by States under section 618
16 - 19. Dispute Resolution 14. Post School Outcomes 2. Dropout Rates 1. Graduation Rates 4. Suspensions/ Expulsions 13. Post Secondary Transition 3. Participation and Performance on Statewide Assessments 20. Data 5. Educational Settings 7. Early Childhood Outcomes 6. Pre-School Educational Settings 15. General Supervision 11 and 12. Child Find 9 and 10. Disproportionality 8. Parent Involvement
The Determination Process December 2005: States submitted State Performance Plans (SPPs) February 1st, every year, states submit Annual Performance Reports (APRs) and if applicable, revised SPPs Information obtained through monitoring visits Special conditions From February to May each year, Secretary reviews SPPs/APRs and considering multiple additional factors makes determinations Information obtained through fiscal monitoring State single audit findings Other public information made available June: Secretary releases determinations based on data reported in SPPs/ APRs and other available data Secretary takes specific technical assistance or enforcement actions (as required)
The Determination Process • Meets Requirements • Needs Assistance • Needs Assistance for two consecutive years • Needs Intervention • Needs Substantial Intervention
Determination Process (Before RDA) • In regard to SPP/APR Indicators • Data:With respect to data, OSEP examines whether the States provided valid and reliable data for all indicators • Compliance: OSEP examines Indicators 4B, 9, 10, 11, 12, 13, 15, 16, 17, and 20 looking for evidence that the State demonstrates substantial compliance. • Meets Requirements: Generally, and absent any other issues OSEP considers a State to “meet requirements” if the State: (1) Provided valid and reliable data; and (2) Demonstrated substantial compliance for compliance Indicators.
Results Driven Accountability Based on OSEP’s Presentation of August 2012
Steps in OSEP’s RDA Development Process • OSEP offered opportunities for input, starting on March 23rd, 2012 • OSEP staff presented updates on meetings and conference calls • General public input via blog, email, etc. • OSEP is working with OSEP Sponsored Projects on what and how results data can be used for RDA • OSEP Memo 13-6, dated 12/12/12
States Aggregate Performance on Selected Compliance Indicators Data Source: OSEP
Academic Proficiency for Students with Disabilities Data Source: OSEP
The primary focus of Federal and State monitoring activities shall be on- • improving educational results and functionaloutcomesfor all children with disabilities • ensuring that States meet… the program requirements, with… emphasis on those most related to improving results 20 U.S.C. 1416(a)(2) Sec. 616(a)
Components of RDA • SPP/APR – APR Indicators measure results • Determinations – Broadly reflect State performance (not just compliance and accurate data) • Differentiated monitoring and technical assistance based on weighted identification of States
OSEP Updates: Memo 13-6 • Memo 13-6 was released to states on 12/12/12 • Includes the FFY 2011 SPP/APR Instructions for the SPP/APR submission that was due Feb 1st 2013 • Includes information on how RDA may impact States Determinations • Results indicators may be included in the determination process! • State-to-School District determinations may be impacted as well.
In what Concerns to RDA About State Determinations, Memo 13-6 indicates: • OSEP is considering how it will use data from results indicators in making determinations in the spring of 2013. • OSEP is developing a “State Results Matrix” that will be used to examine a variety of results data. • Example included in the Memo was Statewide Assessment, based on Indicator 3 (since this was presented as an example, it indicates other results indicators may be included)
Example included in Memo 13-6 State Assessments • Participation rate in general statewide reading and math assessments (similar to 3b), • Proficiency on assessments (similar to 3a), • Improvement in proficiency on assessments, and • The gap in proficiency on assessments between students with disabilities and all students.
Results Matrix Example Decision Matrix: Reading and math combined • Element 1: Participation in general assessment • Element 2: Improvement in percent proficient • Element 3: Gap in proficiency between students with disabilities and students without disabilities • Element 4: Percent proficient or above Source: NCEO
Results Matrix Source: NCEO
How is Idaho Performing on Selected Results Data? Comparing Idaho to RRC Region 6 (WRRC) and National Data where available
14. Post School Outcomes Dispute Resolution 2. Dropout Rates 1. Graduation Rates 4. Suspensions/ Expulsions 13. Post Secondary Transition 3. Participation and Performance on Statewide Assessments Data 5. Educational Settings 7. Early Childhood Outcomes General Supervision 6. Pre-School Educational Settings 11 and 12. Child Find 9 and 10. Disproportionality 8. Parent Involvement Slide 47
Post School Outcomes: Idaho Trend Data Source: Idaho FFY 2011 APR Back
Graduation Rates Data Source: IDEA Section 618, Table 4-1. Students ages 14 through 21 with disabilities served under IDEA, Part B, who exited school Graduated with Diploma Grad Rates = X 100 (Graduated with Diploma + Received a Certificate + Reached Maximum Age + Dropped out) Not included on denominator: - Transferred to Gen Education; - Moved and Known to Continue; - Died Back
Special Education Graduation Rates 2009-2010 Back Source: Section 618 Data
Special Education Graduation Rates Note: Information from RMI, FSM and Palau is not included on 618 data tables. Back Source: Section 618 Data
Special Education Graduation Rate Trends (comparing 2005 to 2009) Back Source: Section 618 Data
Special Education Graduation Rate Trends (comparing 2005 to 2009) Note: Information from RMI, FSM and Palau is not included on 618 data tables. Source: Section 618 Data Back
Dropout Rates Data Source: IDEA Section 618,Table 4-1. Students ages 14 through 21 with disabilities served under IDEA, Part B, who exited school # 14-21 Dropped out Dropout Rates = X 100 (#14-21 Graduated with Diploma + Received a Certificate + Reached Maximum Age + Dropped out + Transferred to General Education + Moved, Known to Continue + Died)
Special Education Dropout Rates 2009-2010 Source: Section 618 Data Back
Special Education Dropout Rates 2009-2010 Note: Information from RMI, FSM and Palau is not included on 618 data tables. Back Source: Section 618 Data
Special Education Dropout Rate Trends (comparing 2005 to 2009) Note: Information from RMI, FSM and Palau is not included on 618 data tables. Source: Section 618 Data Back
Special Education Dropout Rate Trends (comparing 2005 to 2009) Note: Information from RMI, FSM and Palau is not included on 618 data tables. Source: Section 618 Data Back
Participation for Students with IEPs (Indicator 3.B) Source: Idaho FFY 2011 APR Back
Performance of Students with IEPs (Indicator 3.C) Source: Idaho FFY 2011 APR Back
The Idaho SDE received an ESEA waiver in 2012 • Idaho will be using an Achievement Annual Measureable Objective (AMO) with the following targets: Source: Idaho FFY 2011 APR Back
Statewide Assessment, Reading, Grade 4 (NAEP Data, 2005 and 2011) Scale Score: A score, derived from student responses to assessment items, that summarizes the overall level of performance attained by that student. While NAEP does not produce scale scores for individual students, NAEP does produce summary statistics describing scale scores for groups of students. NAEP subject area scales typically range from 0 to 500 (reading, mathematics, U.S. history, and geography) or from 0 to 300 (science, writing, and civics). Back
Statewide Assessment Grade 4 – Reading (Trend from 2005 to 2011) Source: Section 618 Data Back
LRE: Regular Classroom > 80% Fall 2010 Note: Information from RMI, FSM and Palau is not included on 618 data tables. Source: Section 618 Data Back
LRE: Regular Classroom > 80% Fall 2010 Note: Information from RMI, FSM and Palau is not included on 618 data tables. Back Source: Section 618 Data
LRE: Regular Classroom > 80% 5-Year Trend (from 2006 to 2010) Note: Information from RMI, FSM and Palau is not included on 618 data tables. Back Source: Section 618 Data
LRE: Regular Classroom > 80% 5-Year Trend (from 2006 to 2010) Note: Information from RMI, FSM and Palau is not included on 618 data tables.
LRE: Regular Classroom < 40% Fall 2010 Note: Information from RMI, FSM and Palau is not included on 618 data tables. Source: Section 618 Data
LRE: Regular Classroom < 40% Fall 2010 Note: Information from RMI, FSM and Palau is not included on 618 data tables. Source: Section 618 Data
LRE: Regular Classroom < 40% 5-Year Trend (from 2006 to 2010) Back Source: Section 618 Data Note: Information from RMI, FSM and Palau is not included on 618 data tables.
LRE: Regular Classroom < 40% 5-Year Trend (from 2006 to 2010) Note: Information from RMI, FSM and Palau is not included on 618 data tables. Source: Section 618 Data Back
14. Post School Outcomes Dispute Resolution 2. Dropout Rates 1. Graduation Rates 4. Suspensions/ Expulsions 13. Post Secondary Transition 3. Participation and Performance on Statewide Assessments Data 5. Educational Settings 7. Early Childhood Outcomes General Supervision 6. Pre-School Educational Settings 11 and 12. Child Find 9 and 10. Disproportionality 8. Parent Involvement
14. Post School Outcomes Dispute Resolution 2. Dropout Rates 1. Graduation Rates 4. Suspensions/ Expulsions 13. Post Secondary Transition 3. Participation and Performance on Statewide Assessments Data 5. Educational Settings 7. Early Childhood Outcomes General Supervision 6. Pre-School Educational Settings 11 and 12. Child Find 9 and 10. Disproportionality 8. Parent Involvement