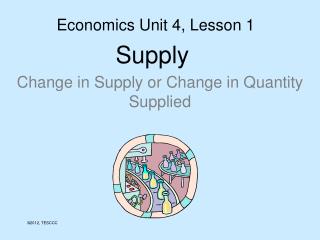
Understanding Supply: Key Concepts and Determinants in Economics
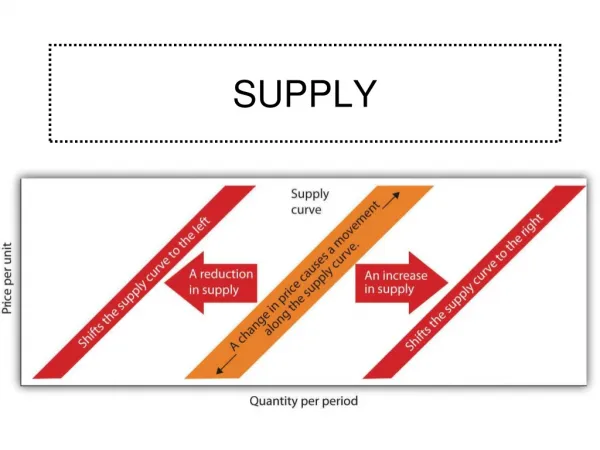
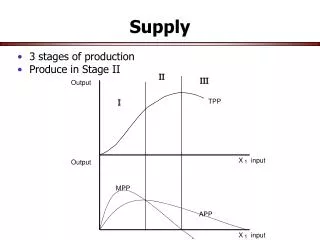
Supply refers to the relationship between the quantities of a good that sellers are willing and able to sell at various prices. The law of supply states that as prices increase, the quantity supplied also increases, demonstrating a direct relationship. Determinants of supply include the number of sellers, resource prices, technology, prices of other goods, random events, expectations, and taxes or subsidies. Changes in these factors can shift the supply curve, affecting how much of a good is available in the market at different price points.

Understanding Supply: Key Concepts and Determinants in Economics
E N D
Presentation Transcript
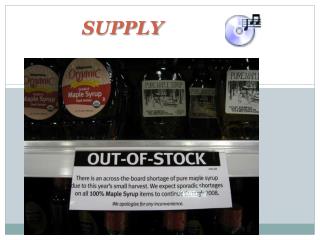
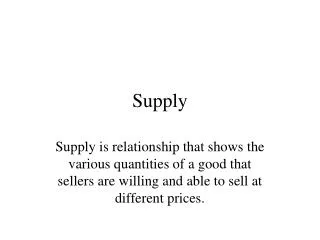
Supply Supply is relationship that shows the various quantities of a good that sellers are willing and able to sell at different prices.
Supply of Good Z Price Quantity Supplied $1.00 5 2.00 10 3.00 15 4.00 20 5.00 25 6.00 30
Supply Curve for Good Z Price 6 S 5 4 3 2 1 10 20 30 Quantity Supplied 0
Law of Supply Price and quantity supplied are directly related.
Determinants of Supply • Number of Sellers • Prices of Resources • Technology • Prices of Other Goods • Random Events • Expectations • Subsidies and Taxes
Change in Quantity Supplied Price 6 S 5 B 4 A 3 2 1 10 15 20 30 Quantity Supplied 0
Change in Supply Curve (Increase) Price 6 S1 S2 5 4 3 2 1 10 20 30 Quantity Supplied 0
Change in Supply Curve (Decrease) Price S2 6 S1 5 4 3 2 1 10 20 30 Quantity Supplied 0