Download
1 / 4
50 likes | 148 Views
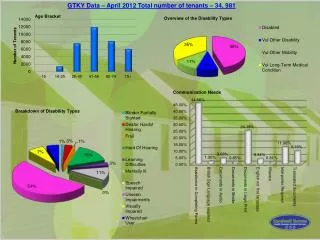
This analysis delves into the exclusion details of tenant data in April 2012, highlighting language representation and specific exclusions for better clarity. English is the predominant language, with significant exclusion to optimize understanding.

E N D
The graph has exclusions to ensure that it is more a understandable. The exclusions includes English which represents the most common language read with 83.3% (29171) and data on the tenants we do not have data for which equates to 12.5% (4393). The graph has exclusions to ensure that it is more understandable. The exclusions include English which represents the most common language spoken with 79% (27661) and data on the tenants we do not have for which equates to 17.4% (6120).
In order to make the graph more understandable the White British category has been excluded as it is the largest ethnic group with 28,206 (8 1%) tenants stating that they are White British.