EAS 4/8803: Experimental Methods in AQ
260 likes | 371 Views
This comprehensive overview of Air Quality Management (AQM) covers the historical context of the Clean Air Act, its objectives, and the introduction of National Ambient Air Quality Standards (NAAQS). It highlights the significance of controlling emissions of key pollutants such as Ozone (O3), Nitrogen Oxides (NOx), Carbon Monoxide (CO), Sulfur Dioxide (SO2), and Particulate Matter (PM), detailing various principal measurement techniques. The document further delves into the methodologies used for measuring these pollutants, including NDIR and UV absorption, alongside challenges like interference, detection limits, precision, and stability, ultimately emphasizing the importance of these practices in maintaining clean air and public health.

EAS 4/8803: Experimental Methods in AQ
E N D
Presentation Transcript
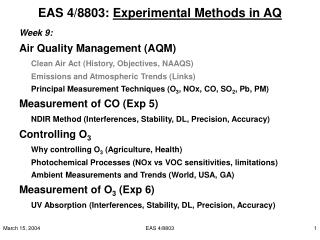
EAS 4/8803: Experimental Methods in AQ Week 9: Air Quality Management (AQM) Clean Air Act (History, Objectives, NAAQS) Emissions and Atmospheric Trends (Links) Principal Measurement Techniques (O3, NOx, CO, SO2, Pb, PM) Measurement of CO (Exp 5) NDIR Method (Interferences, Stability, DL, Precision, Accuracy) Controlling O3 Why controlling O3 (Agriculture, Health) Photochemical Processes (NOx vs VOC sensitivities, limitations) Ambient Measurements and Trends (World, USA, GA) Measurement of O3 (Exp 6) UV Absorption (Interferences, Stability, DL, Precision, Accuracy) EAS 4/8803
Physical and Chemical Measuring Principles EAS 4/8803
Applied Measuring Techniques EAS 4/8803
Photometry: IR Absorption Bands EAS 4/8803
Photometry: UV Absorption Spectra EAS 4/8803
MoO / Au ~350oC NO/NOy Analyzer Inlet Box EAS 4/8803
From inlet box Hz NO + O3 NO2* + O2 NO + O3 NO2 + O2 NO2* NO2 + hv NO2* + M NO2 + M Chemiluminescence of NO and all reduced NOy species: Converter efficiency critical!! NO2, NO3, N2O5, HONO, HNO3, aerosol NO3-, PAN and other organic nitrates Excess O3 PMT HV PMT C Chemi-lumi-nescence 600-3200 max 1200 nm Reaction Vessel NC NO Zero Volume O3 Trap NO/NOx/NOy Method: Chemiluminescence EAS 4/8803
NO/NOy Analyzer Operation SnoopNOy_cps: Photon counts per s NOyNO: NO measure mode NOy: NOy measure mode NOyNO0: NO zero mode NOy0: NOy zero mode Sensitivities (cps/ppt) S_NO = (NOcal-NOipol)/[NOnom] S_NO2 =(NOyNO2cal-NOyipol)/[NO2nom] S_NPN=(NOyNPNcal-NOyipol)/[NPNnom] S_HNO3=(NOyHNO3cal-NOyipol)/[HNO3nom] MR Calculation NO (ppbv) = (NO-ZVeff*NO0)/S_NO NOy (ppbv) = (NOy-ZVeff*(NOy0-NO0)-NO)/S_NO2 + (NO-ZVeff*NO0)/S_NO - ANO2 DQI CDS_NO = S_NO * exp(kt[O3]) DL1min = 2*SQRT(S(NO0))/60/CDS_NO ZVeff = (NOcal-NOcal0)/(NOcal-NOmeas) ANO2 = (NOymeas-NOy0)ZA/S_NO2 QNO2/NPN/HNO3 = S_NO2_NPN_HNO3/ CDS_NO EAS 4/8803
NO2 Specific Conversion for NOx Typical Data Quality Achieved Comm NO NOy NOx NO T (s) <1 <1 <1 60 DL1min (ppb) 0.003 0.5 0.5 0.075 DL30min (ppb) 0.0005 0.1 0.1 0.01 P (%) 10 15 15 >10 A (%) 15 20 20 >15 EAS 4/8803
Pulsed source 190-320 nm Fluorescence 320-380 nm SO2 Method: UV-Fluorescence EAS 4/8803
SO2 Analyzer Setup EAS 4/8803
SO2 Analyzer Operation SPAN: Standard addition every 12 h. ZTeff CHECK:Zero mode on top of SPAN every 24 h. ZERO: Instrument background or baseline every hour. EAS 4/8803
SO2 Signal Evaluation & Data Reduction • Identify instrument baseline from zero modes SO2,0 • Correct for zero trap efficiency < 100%: SO2,0* = SO20 / ZTeff – SO2ipol * (1/ZTeff-1) • Interpolate between SO2,0* over the data set: SO2,0*ipol • Subtract corrected baseline from amb signal: SO2net = SO2raw – SO2,0*ipol • Identify instrument span from cal modes SO2span • Determine instrument sensitivities (ppb/Vdc): SO2sens = Fcal/Ftot * [SO2cal] / SO2span • Interpolate between SO2sens over the data set: SO2sensipol • Determine final SO2 mixing ratio (ppb): SO2 = SO2net * SO2sensipol Determine SO2 data quality indicators: Lower Detection Limit (ppb) DL = t * STD(SO20*) * AVG(SO2sens) Zero Trap Efficiency (%) ZTeff = (SO2span – SO2span0) / (SO2span – SO20) Precision (%) P = t * STD(SO2sens) / AVG(SO2sens) *100 Accuracy (%) A = (slope {lin regress multi-pt cal} – 1) *100 EAS 4/8803
SO2 Data Quality Typically Achieved Commercial T (s) 45 60 DL1min (ppb) 0.05 0.1 DL30min (ppb) 0.01 0.02 P (%) 6 >10 A (%) 15 >20 EAS 4/8803
Emissions/AQ Trends: CO Sources (2001) Emissions • Potential Risks andEffects • Blood-O2 deficiency • Cardiovascular (angina pectoris) • Visual, neurological impairment • Role in P(O3) via HOx cycle (slow) AQ EAS 4/8803
T Thermo-electrically cooled PbSe insulation 16 m 30 Hz 360 Hz modulation 4.7 mm CO Method: IR-Absorption I = I0 e-e c l EAS 4/8803
CO Analyzer Setup EAS 4/8803
CO Analyzer Operation SPAN: Standard addition every 24 h. ZTeff CHECK:Zero mode on top of SPAN every 24 h. ZERO: Instrument background or baseline every 12 minutes. EAS 4/8803
CO Signal Evaluation & Data Reduction • Identify instrument baseline from zero modes CO0 • Correct for zero trap efficiency < 100%: CO0* = CO0 / ZTeff – COipol * (1/ZTeff -1) • Interpolate between CO0* over the data set: CO0*ipol • Subtract corrected baseline from amb signal: COnet = COraw – CO0*ipol • Identify instrument span from cal modes COspan • Determine instrument sensitivities (ppb/Vdc): COsens = Fcal/Ftot * [COcal] / COspan • Interpolate between COsens over the data set: COsensipol • Determine final CO mixing ratio (ppb): CO = COnet * COsensipol Determine CO data quality indicators: Lower Detection Limit (ppb) DL = t * STD(CO0*) * AVG(COsens) Zero Trap Efficiency (%) ZTeff = (COspan – COspan0) / (COspan – CO0) Precision (%) P = t * STD(COsens) / AVG(COsens) *100 Accuracy (%) A = (slope {lin regress multi-pt cal} – 1) *100 EAS 4/8803
CO Data Quality Typically Achieved Commercial T (s) 20 60 DL1min (ppb) 50 100 DL30min (ppb) 10 20 P (%) 8 >15 A (%) 12 >20 EAS 4/8803
MnO2 400C IR A-Cell ZT Sample IN during regular operation NC Tee NV set so that ΔP(Tee-NO) in Sample mode = ΔP(Tee-NC) in Zero mode C NO CO Analyzer Setup at Rooftop Lab EAS 4/8803
MnO2 400C IR A-Cell ZT Tee NV set so that ΔP(Tee-NO) in Sample mode = ΔP(Tee-NC) in Zero mode 10 sccm CO NC MFM 1425 ppmv in N2 C Zero Air MFC 10 slm NO CO Analyzer Calibration Vent out during calibration Manual connect during calibration EAS 4/8803
Lab Setup (to scale) EAS 4/8803
Cal Gas Dilution System Cal Gas MFM Zero Air MFC Tank Cal Gas Standard is (NIST certified) 1425 ppmv CO in N2 Generate and supply min 4 different nominal concentrations [COnom] = (Fcal*COtank) / (Fcal + FZA) Hold FZA = const, since [COZA] > 0 !! EAS 4/8803
D[COnom]3 D[COnom]2 D[COnom]1 COspan0 CO0 CO Calibration Record and Evaluation Determine: COsens = D[COnom] / DCOspan ZTeff = (COspan – COspan0) / (COspan – CO0) CO0* = CO0 / ZTeff – COipol * (1/ZTeff-1) COnet = COraw – CO0*ipol CO = COnet * COsensipol DL = t * STD(CO0*) * COsens P = t * STD(COsens) / AVG(COsens) *100 A = (slope {lin regress multi-pt cal} – 1) *100 EAS 4/8803
Student t values and Confident limits Assume normal distribution! N-1 degrees of freedom. 95 % confidence interval. EAS 4/8803