Download
1 / 18
180 likes | 479 Views
Mapping a trait. Types of trait: Monogenic Polygenic-Quantitative-continuous QT are the cumulative effect of many genes and are environment dependent . Mapping a Quantitative trait:. Select a trait of interest Chose contrasting parents Develop mapping population

E N D
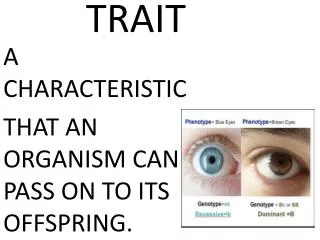
Types of trait: Monogenic Polygenic-Quantitative-continuous QT are the cumulative effect of many genes and are environment dependent
Mapping a Quantitative trait: Select a trait of interest Chose contrasting parents Develop mapping population Phenotypic and genotypic characterization Computation of phenotypic and genotypic data to identify Marker-Trait linkage
Mapping population: • A population used for gene mapping is commonly called a mapping population. • Mapping populations are usually obtained from controlled crosses. • Decisions on selection of parents and mating design for development of mapping population and the type of markers used depend upon the objectives of experiments, availability of markers and the molecular map.
Characterization of Mapping Populations Precise molecular and phenotypic characterization of mapping population is vital for success of any mapping project. The molecular genotype of any individual is independent of environment, it is not influenced by G x E interaction. Trait phenotype could be influenced by the environment, particularly in case of quantitative characters. It is important to precisely estimate the trait value by evaluating the genotypes in multilocation testing over years using immortal mapping populations to have a valid marker-trait association.
Statistical methods for QTL mapping: • ANOVA/Regression: SMA/SMR= Single Marker Analysis/Single Marker Regression • Likelihood ratio/LOD score method: SIM/CIM= Simple Interval Mapping/Composite Interval Mapping • Bayesian method: Its implemented reversible jump Markov chain Monte Carlo (MCMC) algorithm Softwares for QTL mapping: QGENE ICIM-ADD WinQTL-Cartographer MapManager QTX QTL Network R/qtl G-Mendel MapDisto
QGENE for QTL mapping: QGene is a program designed by Clare Nelson. It is a very user friendly program for QTL analysis, NIL selection, and has many other functions. It is especially geared for Advanced Backcross populations, for which most current software is either not applicable or user friendly for plant breeders. Nelson JC (1997) QGENE: software for marker-based genomic analysis and breeding. Molecular Breeding 3: 239-245.
System requirements • For the current version of QGene (4.3.10), you will need: • JavaJDK version 1.5 or higher. Version 1.6 is recommended • 512 MB of memory or better • NOTE: While QGene may run under Java JRE instead of JDK, several analyses will run much slower than expected, in particular permutation analysis. This is because JRE does not fully support multi-threading. So be sure to install the JDK, not just the JRE! • NOTE:QGene can run with memory as little as 64 MB. That may be sufficient for simple QTL or trait analysis, but isn't recommended. However, eQTL analysis needs at least 512 MB of memory.
Download and installation: • It is free, so everybody can download by clicking the link: www.qgene.org/qgene/download.php • a download version was supplied, please install first JAVA (JDK or JRE) and then Qgene and also create a shortcut to the desktop for quick tour of Qgene all the time.
Data format: • The standard format for importing marker, map, and trait data into QGene is as a .qdffile • Prepare a Excel file as per instruction and converted in to TEXT file by clicking file format as TEXT TAB DELIMITED option. • Then change the file extention name .txt to .qdf
Explanation of file composition: [Header] section TheStudy name will be used to identify the data set, so use an informative (though not too long) name. The Mating string describes the genetic model to be used. r (standard recombinant-inbred progeny), b (backcrossing), d (doubled-haploid) and s (selfing). To specify generation like a BC1F1 design, for example, write only b. An F2 will be s, an F3 ss, and a series of three backcrosses followed by a selfingbbbs. Did you backcross twice, self once, randomly intercross twice, and backcross again? No trouble: that's bbsiib. TheGenotype symbolsare ABHCDX or 123450 system (A/1= Parent1, B/2= Parent2, H/3= Heterozygous, C/4= A- , D/5= a- and X/0= missing) TheParent1 and Parent2 entries provide QGene with labels for QTL effect plots, where analysts wish to determine the parental origin of a superior QTL allele -- and may be used in other plots such as for marker segregation, showing parental means on histograms, etc. If you don't provide names for the parents, QGene will default to A and B.
[Locus] section Here the map and marker genotype (technically, marker phenotype) data are given. First word in the row is the marker name, followed by the chromosome and cM position of the marker and finally the marker data. [Trait] section The first word on each line is the trait name. The second word must be either N, O,or M -- indicating the trait to be nominal, ordinal, or metric. As with the marker data, QGene will verify that the numbers of trait values are consistent among traits and also with those of marker data.
Run Qgene: Make a new folder for storing input file, result files and images in a destination drive Open Qgene by double clicking qgene desktop shortcut or by clicking qgene.exe Click file menu and then click LOAD DATA Select .qdf file (where you save the input file) Data manager will appear (here you can view trait histogram, Linkage map and marker data) Save Linkage map and marker data by clicking view as image file
Trait Analysis: Click Analysis on menu bar Click again Trait Analysis a new window will appear for trait analysis (here you can see the distribution of each trait by clicking each trait through histogram and by seeing the P value of Kolmogorov-Smirnov normality test and other tests) In trait analysis you can do Correlation and Regression among traits. You can Export Analysis results and images by clicking file
QTL Mapping: Click Analysis on the main menu bar and then click on QTL-mapping ( a new window ‘Main Analysis’ will appear) In this window there are two panel (select 1 or all 12 chr on the left panel and select at least 1 trait then go right panel and click + sign of Single Marker Regression) There are Horizontal and Vertical Zoom button at upper and right panel (by using these you can adjust whole picture in the window) Click the LOD box and see there are any Significant Peak of QTL (LOD >3) In general threshold LOD is 3 but you can calculate through permutation test For permutation test: click ‘Resampling’ on the main analysis window, then click on ‘Permutation ‘- a new window will appear ‘Permutation Analysis’ Set ‘Iteration no. 1000 and click start button below the trait panel Two line will appear- lower line is the value for significance at 5% and upper is 1% (you can see the value at upper portion of window)
QTL mapping (contd): For saving image and files, click file menu and export images and files Following the same procedures you can analyzed all trait. Close the permutation window In main analysis window click the box of LOD, R2, Add effect and Dominance effect and then go File menu for saving images and files in text format (text files can be changed to Excel file by changing the extension as .xls) Follow same procedure for analyzing through SIM and CIM (incase of CIM additional option is to select co-factor as default from option of Main Analysis window )