Download
1 / 20
200 likes | 279 Views
I am Kaoru Tachiiri, an environmental scientist with expertise in disaster prevention and remote sensing studies. My career includes research on desertification, drought, and infectious diseases, presented at various international forums. Using existing datasets, I conduct continental and regional scale studies employing remote sensing, GIS, and modeling techniques. Notable projects include land assessment in East Asia and monitoring desertification in Inner Mongolia. I have contributed to atmospheric correction models and livestock mortality predictions in Mongolia. My work aims to address climatic challenges and mitigate environmental disasters.

E N D
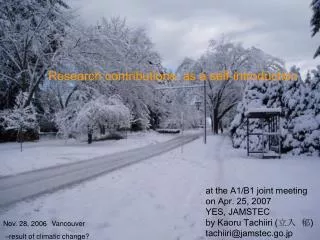
Research contributions: as a self-introduction at the A1/B1 joint meeting on Apr. 25, 2007 YES, JAMSTEC by Kaoru Tachiiri (立入 郁) tachiiri@jamstec.go.jp Nov. 28, 2006Vancouver –result of climatic change?
Brief career 0. Born in June, 1970, Ibaraki City, Osaka (0-18) 1. Kyoto (B Sci, M. Eng. Kyoto U., 18-25) Yoshida Dormitory, Alpine Club Modeling (chaotic) vegetation activity using NN. 2. Tokyo (Ph.D (Agr), U. of Tokyo, 25-28) “Monitoring and modeling desertification using environmental information in drylands of Northeast China”(Supervisor: Prof. Takeuchi) 3. Tsukuba (JSPS Research Fellow, U. of Tsukuba, 28-31) Received 2 Encouragement Awards 4. Nagasaki (R. Associate, Nagasaki U., 31-33) (Got married) 5. Vancouver (Postdoc, UBC, 33-36) JICA Project (training of the meteorological agency, Mongolia) 6. Yokohama (Scientist, 36-?) Kakushin P. Field: Inner Mongolia (China), Kenya, Burkina Faso, BC (Canada), Mongolia Some (non-JAMSTEC) friends involved in the Kakushin P (NEID, DPRI (Kyoto-U))
Photos of Vancouver, BC Downtown, from the Kits Beach The Burrard Bridge The Queen Elizabeth Park The Stanley Park Van Dusen Park
UBC, a beautiful university The Rose Garden Totem pole The Nitobe Garden On-campus trail A squirrel at my apartment
Research contributions Continental scale studies using existing datasets Regional scale studies ・Remote sensing ・GIS ・Model(l)ing Disaster prevention/mitigation (Desertification, Drought, Infectious disease)
Studies presented • Continental scale land assessment: 1. Land classification of East Asia 2. Drought frequency estimation of North Africa • Regional scale environmental monitoring/modeling: 3. Desertification in InnerMongolia, China 4. Atmospheric correction of NOAA/AVHRR (Kenya) 5. Drought/Dzud* monitoring in Mongolia 6. WNV monitoring/modeling in BC, Canada * Climatic disaster (ex. snow, wind) causing significant livestock mortality in winter
Continental scale studies 1. Land classification of East Asia • Input: • Elevation (ETOPO5) • Temperature (NCAR) • Precipitation (NCAR) • Soil type (FAO, qualitative) • Vegetation type (Matthews, qualitative) • Extent • E60 °-160 °, S20 °-N60 ° • Resolution • 1°X 1 ° • Reclassification (to 10 classes) • Correspondence Analysis • Cluster Analysis • Classification map
First axis: Precipitation • Second axis: Temperature and Precipitation • Distribution of each land type is understandable by a latitudinal structure and a concentric one.
Land type vs Land degradation Count Non-degraded, Low, Medium, High, Very high as 0,1,2,3,4 and then averaged. • Overlay the resultant map with the Global Assessment of Human Induced Soil Degradation (GLASOD) Intensity of soil degradation Land type • Humid tropics (9,10) have the most serious water erosion. • Semi-arid area (2-5) have not only wind but water erosion.
2. Drought frequency estimation of North Africa IGBP land cover data NCAR rainfall data Drought is defined as: (1) Back-to-back dry years (<300mm rainfall), for cultivated area (2) Two year average is < (AVG – STD), for grazed area Interpolated by TIN (triangulated irregular network) Estimated drought frequency for cultivated area Estimated drought frequency for grazed area
Regional scale environmental monitoring/modeling Low terrace - Meadow soil Low terrace - Sandy soil Low terrace - Salinized soil Large sand dune - Sandy soil Small sand dune - Sandy soil Flood plain - Meadow soil Flood plain - Sandy soil 3. Desertification in InnerMongolia, China • Landsat/MSS (TSAVI) • By land type • NOAA/AVHRR (Seasonal change) • CORONA (1960s)
Development of desertification model Bareland area derived from Landsat/MSS in1975-1994 By year For 20 yrs MR MR Interestingly, there was a strong negative correlation between the spring’s rainfall and the summer’s vegetation. Natural condition module (Uncontrollable)・Rainfall・Land condition Social condition module (Controllable)・Livestock density・Other human factors Integration MR: Multiple Regression prediction
4. Atmospheric correction of NOAA/AVHRR (Kenya) From Google Map
Atmospheric correction using 6S • Linear extension of 6S (existing code for atmospheric correction) for NOAA/AVHRR images (by decoupling absorption and scattering) (y: Observed radiation, acr: Actual reflectance or radiation)
5. Drought/Dzud monitoring in Mongolia Average livestock loss rate in 2000-2002
Tree based model (regression tree) More robust method is needed Result of linear regression The dependent variable: livestock mortality Independent: NDVI, SWE, population, previous mortality
Input: • Anomalies in NDVI and Snow Water Equivalent (RS based) • Previous year’s livestock number and mortality Output: • predicted livestock mortality Emergency is predicted by: • Low NDVI in August* • High mortality * • High SWE in December * *: Variable in the previous year [All parameters are previous year’s] Start NDVI in Early-Aug<0.99*AVG? N Y Livestock loss ≥6.0%? N Y SWE in Dec≥0.37*AVG? N Y NDVI in Late-Aug<0.94*AVG? N Y Serious Dzud
6. WNV monitoring/modeling in BC, Canada • Identified 1937 in Uganda • As BC is the forefront, BCCDC* needs to assess the risk. • Birds and mosquitoes are important in infection cycle. • 20% symptomatic (fever, headache, body aches etc). • Death rate: approximately 1% *: British Columbia Centre for Disease Control
Mosquito biology model (Process model) • Input: temperature ←T(x)=m(x)+ε1(x)+ε2(x) m(x): regressed by elevation, cos(latitude) and distance to the sea ε1(x) and ε2(x): spatially dependent and independent residuals • Important parameters: growth rate (dd, cf. gdd5 in SEIB-DGVM) and mortality • Time step: 1 day • Output: No. of Adultmosquitoes • Data for validation: BCCDC*’s mosquito trap data *: British Columbia Centre for Disease Control