Download
1 / 1
10 likes | 131 Views
THE NEAR-INFRARED S0 SURVEY: A STUDY OF BAR STRENGTHS IN EARLY-TYPE GALAXIES R. J. Buta (U. Alabama), E. Laurikainen and H. Salo (U. Oulu), D. L. Block (U. Witwatersrand), J. H. Knapen (U. Hertfordshire). BACKGROUND. RESULTS.

E N D
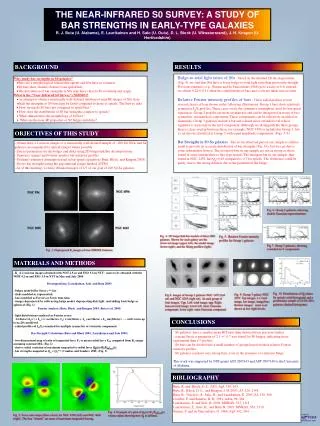
THE NEAR-INFRARED S0 SURVEY: A STUDY OF BAR STRENGTHS IN EARLY-TYPE GALAXIES R. J. Buta (U. Alabama), E. Laurikainen and H. Salo (U. Oulu), D. L. Block (U. Witwatersrand), J. H. Knapen (U. Hertfordshire) BACKGROUND RESULTS • Bulge-to-total light ratios of S0s - based on the detailed 2D decompositions (Fig. 4), we find that S0s have a lower bulge-to-total light ratio than previously thought. Previous estimates (e.g., Simien and de Vaucouleurs 1986) gave a ratio of 0.6; instead, we obtain 0.24+/-0.11 when the contributions of bars and ovals are taken into account. • Relative Fourier intensity profiles of bars - These radial profiles reveal several classes of bars shown in the following illustrations. Group 1 bars show relatively symmetric Im/I0 profiles. These cases verify the symmetry assumption used for bar-spiral separation. Group 2 profiles are more asymmetric and can be interpreted in terms of two symmetric, mismatched components. These components can be effectively modeled as Gaussians. Group 3 galaxies include a bar and a much more extended oval whose signature is seen only in the m=2 component. Although we distinguish the three groups, there is clear overlap between them; for example, NGC 4596 is included in Group 1, but it can also be classified as Group 2 with equal amplitude components. (Figs. 5-9). • Bar Strengths in S0-Sa galaxies - The so-far-observed part of our sample is still too small to provide an accurate distribution of bar strengths (Fig. 10), but we can derive some information from it. The strongest bars in our sample are not as strong as those found in some intermediate to late-type spirals. The strongest bar in our sample, that found in NGC 1452, has Qg=0.48 compared to 0.7 for spirals. The difference could be partly due to the strong dilution due to the potential of the bulge. • Why study bar strengths in S0 galaxies? • Bars are a morphological feature that spirals and S0s have in common • S0 bars show features distinct from spiral bars • The distribution of bar strengths in S0s may have clues to S0 evolution and origin. What is the “Near-Infrared S0 Survey” (NIRS0S)? • an attempt to obtain a statistically well-defined database of near-IR images of S0s from which the strengths of S0 bars may be fairly compared to those of spirals. The Survey asks: • How strong do S0 bars get compared to spiral bars? • How does the distribution of S0 bar strengths compare to spirals? • What characterizes the morphology of S0 bars? • What are the near-IR properties of S0 bulges and disks? OBJECTIVES OF THIS STUDY - Obtain deep 2.2 micron images of a statistically well-defined sample of ~200 S0, S0/a, and Sa galaxies, accompanied by optical images where possible - Extract parameters for the bulges and disks using 2D bulge/disk/bar decompositions - Deproject images and Fourier-analyze bar intensity profiles - Evaluate symmetry assumption used in bar-spiral separation (Buta, Block, and Knapen 2003) - Derive bar strengths using the gravitational torque method (GTM) - As of this meeting, we have obtained images of 1/3 of our goal of 200 S0-Sa galaxies NGC 4596 NGC 936 Fig. 6: Group 2 galaxies, showing double Gaussian representations NGC 4608 NGC 4643 Fig. 4: 2D bulge/disk/bar models of three SB0 galaxies. Shown for each galaxy are the observed image (upper left); the model image (lower right); and the fitting profiles (right). Fig. 5: Relative Fourier intensity profiles for Group 1 galaxies Fig 7: Group 3 galaxies, showing extended m=2 components Fig. 1: Deprojected Ks images of four NIRS0S Galaxies MATERIALS AND METHODS - Ks (2.2) micron images obtained with NOT 2.5-m and ESO 3.5-m NTT; more to be obtained with the WHT 4.2-m and ESO 3.5-m NTT in May and July 2006 Decompositions (Laurikainen, Salo, and Buta 2005) - bulges modeled by Sersic r1/n law - disks modeled as exponentials - bars modeled as Ferrers or Sersic functions - images deprojected by subtracting bulge model, deprojecting disk light, and adding back bulge as spherical (Fig. 1) Fourier Analysis (Buta, Block, and Knapen 2003; Buta et al. 2005) - light distributions analyzed as Fourier series: I(r,theta)=I0( r) + I1c( r) cos(theta)+ I1s( r)sin(theta) + I2c cos(2theta) + I2s sin(2theta)+ …. with terms up to m=20 considered - radial profiles of Im/I0 examined for multiple symmetric or Gaussian components Bar Strength Calculation (Buta and Block 2001; Laurikainen and Salo 2002) - two-dimensional map of ratio of tangential force FT to mean radial force F0R computed from Ks image assuming constant M/L (Fig. 2) - derive radial variation of maximum tangential to radial force QT(r)=|FT/F0R|max(r) - bar strength computed as Qg = QTmax(Combes and Sanders 1981) (Fig. 3). Fig. 10: Distribution of Qg values for spirals (solid histogram) and a preliminary sample of 24 S0, S0/a galaxies (dashed histogram). Fig. 9: Group 3 galaxy NGC 2859. Top images, l-r: total image, bar image, image-bar; Bottom images: outer oval shown at low light levels. Fig 8: images of Group 2 galaxies NGC 1452 (left set) and NGC 4245 (right set). In each group of four images: Upp. Left: total image; upp. Right: bar-corrected image; lower left: inner Gaussian component; lower right: outer Gaussian component CONCLUSIONS - S0 galaxies have a smaller mean B/T ratio than deduced from previous studies - a mean Sersic n parameter of 2.1 +/- 0.7 was found for S0 bulges, indicating more exponential than r1/4 profiles - S0 bars can be divided into a small number of groups based on their relative Fourier intensity profiles - S0 galaxies can have very strong bars, even in the presence of a massive bulge This work was supported by NSF grants AST 0205143 and AST 0507140 to the University of Alabama. BIBLIOGRAPHY Buta, R. and Block, D. L. 2001, ApJ, 550, 243 Buta, R., Block, D. L., and Knapen, J. H. 2003, AJ, 126, 1148 Buta, R., Vasylyev, S., Salo, H., and Laurikainen, E. 2005, AJ, 130, 506 Combes, F. and Sanders, R. H. 1981, A&A, 96, 164 Laurikainen, E. and Salo, H. 2002, MNRAS, 337, 1118 Laurikainen, E., Salo, H., and Buta, R. 2005, MNRAS, 362, 1319 Simien, F. and de Vaucouleurs, G. 1986, ApJ, 302, 564 Fig. 3: Example of a plot of QT(r)=|FT/F0R|max(r) versus radius showing how Qg is defined. Fig. 2: Force ratio maps (false colors) for NGC 4596 (left) and NGC 4643 (right). The four “islands” are areas of maximum tangential forcing.