Download
1 / 37
370 likes | 455 Views
Designing and installing new equipment and software for a mock fermentation vessel for automated and computer-controlled operation. Gather data and develop user-friendly interface for smooth operation.

E N D
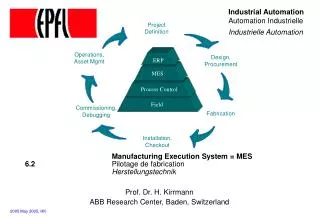
Fermentation Vessel Control & Automation Team: Dec06-07 April 21, 2006
Stephanie Loveland ISU Department of Chemical and Biological Engineering Client Faculty Advisor Dr. Degang Chen Team Members Andrew Arndt, Adam Daters, Brad DeSerano, Austin Striegel
Introduction Acknowledgements Problem Statement Assumptions and Limitations Intended Users and Uses Functional Requirements Technology Considerations Detailed Design Closing Summary Agenda
Acknowledgements • Stephanie Loveland - of Iowa State University Department of Chemical and Biological Engineering for providing finances, design specifications, and requirements for this project • Dr. Degang Chen - of Iowa State University for technical and practical advice
Definitions COM – Serial communications port DAQ – Data acquisition Flash – Animated graphics technology and format from Macromedia, which can be viewed with a web browser plug-in GUI – Graphical user interface I/O – Input/Output LabVIEW – Laboratory Virtual Instrument Engineering Workbench PCI – Peripheral component interconnect PPM – Parts per million PXI – PCI extensions for instrumentation RPM – Rotations per minute RS232 – Standard for serial cable interface SCC – Signal conditioning system offered by National Instruments SLM – Standard liters per minute USB – Universal serial bus VI (virtual instruments) – Sub-unit program in LabVIEW that represents the appearance and function of a physical implement
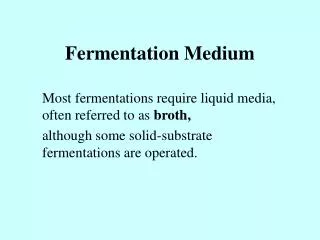
Problem Statement (1/3) A mock fermentation vessel is available for use by senior chemical engineering students to conduct experiments in their final laboratory course. Currently, archaic methods are used to record data Current Mock Fermentation Vessel Layout
Problem Statement (2/3) The objective of this project is to design, update, and install new equipment and software for the mock fermentation vessel apparatus to become automated and computer controlled.
Problem Statement (3/3) Software must also be developed to gather data from the equipment and allow for smooth, efficient operation by the user. The software must be designed in LabVIEW to take readings from the equipment. A user interface needs be developed so that the students can do several different functions with the information streaming in from the lab metering equipment.
Assumptions (1/2) • The end-user of this project will be someone who is familiar with the fermentation process • Only one experiment will be conducted at a time • Environmental stability of 2059 Sweeney will be maintained • All new components and cables will be paid for by the client • The end-user understands basic computer terminology (double-click, scroll, etc) • All laboratory components will operate within their given rated power values
Assumptions (2/2) • A computer will be supplied by the client with LabVIEW and Excel already installed • An extra PCI slot will be available on the computer for data acquisition card • The data acquisition card will supply its own clock
Limitations (1/2) • File format type is in Excel Format • Software shall be written using LabVIEW • One sample per second must be recorded from each specified device • Maximum flow rate for the air/nitrogen must be less than 6 SLM • Motor speed must be kept less than 600 RPM • Safety glasses must be worn at all times when working in 2059 Sweeney
Limitations (2/2) • No more than 4 significant digits stored upon measurement • The voltage signals from the stirrer motor control must be electrically isolated • The oxygen concentration meter must read from 0 to 9.5 PPM dissolved oxygen • The oxygen concentration meter must be a benchtop unit
Intended Users • Senior level students in the Department of Chemical and Biological Engineering as well as faculty within the department • The users must have knowledge of safety procedures and requirements while conducting experiments within the lab • Students will need to have been exposed to the concepts that the lab is designed to simulate
Intended Uses • The intended use of this project is to automate the collection of data from the mock fermentation vessel apparatus • The automation process will yield data in a real-time display as well as saved file format for further data analysis by the users • The end system is not intended to be used on any other equipment that is not supported
Functional Requirements (1/3) Data Acquisition • Obtain measurements of speed, torque, air/nitrogen gas flow, and oxygen concentration from the appropriate measurement devices • Apply proper filtering on the equipment output, to obtain accurate measurements
Functional Requirements (2/3) Data Collection • Record measurements every second • Store measurement information into a Microsoft Excel file format for user download
Functional Requirements (3/3) Software interaction • Develop software using LabVIEW • Display real-time information in a GUI • Easy to use • Contains a user manual detailing operation
Technology Considerations (1/4) • Data Acquisition Board • Signal Conditioning • Oxygen Concentration Meter
Technology Considerations (2/4) Data Acquisition Board • USB DAQ • Inexpensive and Easy Connection • No Signal Conditioning Capability • PXI DAQ System • High Resolution/High Sampling Rate • High Cost • Signal Conditioning Capability • PCI DAQ Board • Moderate Resolution & Sampling Rate • Moderate Cost • Signal Conditioning Capability Technology Selected PCI DAQ Board
Technology Considerations (3/4) Signal Conditioning • No Signal Conditioning • Less Cost • Unable to interface directly with DAQ board • Signal Conditioning • Isolation requirements met for Stirrer Motor Control • Easy interface with DAQ Board • Extra cost of Signal Conditioning Carrier Box Technology Selected Signal Conditioning
Technology Considerations (4/4) Oxygen Concentration Meter • Omega DOB-930 • 100 data point logging • RS232 Interface • Limited support and availability • Thermo Electron Orion 3-Star • 200 data point logging • RS232 Interface • 3-year Extended Warranty and availability up to 5 years Technology Selected Thermo Electron Orion 3-Star
Detailed Design (2/14) Oxygen Concentration Meter • Thermo Electron Orion 3-Star • Full Scale Measurement of Dissolved Oxygen (0-9.5 PPM) • RS232 Bidirectional Interface • 3-year Extended Warranty and availability up to 5 years
Detailed Design (3/14) Oxygen Concentration Meter Interface • Onboard RS232 Connection port for data acquisition • Meter will be configured to transfer data continuously to the PC • Data will be acquired using the onboard COM port of the computer supplied
Detailed Design (4/14) Mass Gas Flow Meter Meter • Omega FMA-5610 • Full Scale Measurement of Gas Flow from 0 to 10 SLM • Analog 4-20mA Output Signal
Detailed Design (5/14) Mass Gas Flow Meter Interface • 9-Pin D Connector: Pins 8-9 current output • SCC-CI20 will be used to convert 4-20mA signal to 0-5V signal • SCC Module will be plugged into the signal conditioning carrier for interface with the DAQ board
Detailed Design (6/14) Mass Gas Flow Meter Interface
Detailed Design (7/14) Signal Conditioning Carrier Unit • SCC Carrier SC-2345 • Direct Cabling to the M-Series DAQ Board • Housing for up to 20 SCC Modules • Powered by DAQ Board with 5V Signal
Detailed Design (8/14) Signal Conditioning Carrier Unit Interface • The Signal Conditioning Carrier Unit will connect to the DAQ board via a 68 pin shielded connector cable
Detailed Design (9/14) Stirrer Motor Control • Glas-Col GKH-Stir Tester • Two Analog voltage outputs (0-5V) • Scaled voltages to represent torque and speed • Operates with a floating ground at 70-90V • 60V fast transient spikes on voltage lines
Detailed Design (10/14) Stirrer Motor Control Interface • 4 pin terminal connection (Differential Voltage) • SCC-AI04 will be used to isolate the analog input up to 300V • Voltages will be measured differentially to protect against transient spikes • SCC Module will be plugged into the signal conditioning carrier for interface with the DAQ board
Detailed Design (11/14) Data Acquisition Card • NI PCI-6221 M-Series DAQ Board • 16 Analog Inputs, 2 Analog Outputs, 24 Digital I/O Lines, 2 Counters/Timers • 16 Bit Resolution – Accuracy of 70μV • Sampling Rate: 250 kilo-samples/sec
Detailed Design (12/14) Data Acquisition Card Interface • Will connect with the Signal Conditioning Carrier via the 68 pin shielded cable • Will supply internal clock for data acquisition of signals • 6 Channels of Analog Inputs will be used for acquiring mass gas flow, torque, and speed • Express VI’s in LabVIEW will define the operation of the DAQ card
Detailed Design (13/14) Software Interfacing • Design GUI for ease of data gathering and running of experiment. • Different visual cues will direct action on part of the user. Examples: Pull down menus, push buttons, and white space for cursor entering. • First screen of GUI consists of initialization of experiment.
Detailed Design (14/14) Software Interfacing • Page two of GUI consists of four live actions graphs that display real time data. • A toggle switch at top will enable users to start and stop gathering data. • An optional pop up screen might be implemented at end of experiment. The pop-up will display all experiment results and conclusions.
Closing Summary A mock fermentation vessel is available for use by senior chemical engineering students to conduct experiments in their final laboratory course. This vessel currently uses archaic methods to operate the equipment and to collect data. The objective of this project is to design an automated system to collect the necessary data for the user. This system will involve the use of a data acquisition card to interface with the current lab equipment, and LabVIEW software will be used to collect the data. A user interface will be created that is simple enough for most users to operate, and will be dynamic enough to display the appropriate information to the user as well as store the information to a file for later analysis. When completed, the entire system should allow end users complete access to data collection from all laboratory equipment. This will ensure a deeper more complete understanding of the fermentation process, and will culture a better environment for learning.