Download
1 / 8
80 likes | 103 Views
This study explores the use of GNOME software to model oil spills in an undergraduate Environmental Geology course. The software allows students to adjust various parameters and observe the movement and dissipation of the spill. The level of detail in GNOME helps users understand the complexity of real oil spills.

E N D
Use of GNOME to model oil spills in an Environmental Geology Course General NOAA Oil Modeling Environment Tim Walsh, Wayland Baptist University
Abstract Software freely available from NOAA’s Office of Response and Restoration includes the CAMEO/ALOHA/MARPLOT suite (to model air pollution) and GNOME (to model oil spills). These programs have been used with students in lab sections of an undergraduate Environmental Geology course. The Galveston Bay area was used in the GNOME models because of familiarity to Texas students and the potential to model hurricane effects on a spill scenario. Students adjust a variety of parameters including pollutant type, changing tides, winds, river flow, and offshore currents. They may then observe an animation of the spill’s movement and potential dissipation. The use of modeling software such as GNOME allows students to interact in a high interest medium. The level of detail of the GNOME model helps users realize the complexity of an actual oil spill.
What is GNOME? GNOME (General NOAA Operational Modeling Environment) is the oil spill trajectory model used by OR&R Emergency Response Division (ERD) responders during an oil spill. ERD trajectory modelers use GNOME in Diagnostic Mode to set up custom scenarios quickly. In Standard Mode, anyone can use GNOME (with a Location File) to: ---predict how wind, currents, and other processes might move and spread oil spilled on the water. ---learn how predicted oil trajectories are affected by inexactness ("uncertainty") in current and wind observations and forecasts. ----see how spilled oil is predicted to change chemically and physically ("weather") during the time that it remains on the water surface. To use GNOME, you describe a spill scenario by entering information into the program; GNOME then creates and displays an oil spill "movie" showing the predicted trajectory of the oil spilled in your scenario. Along with GNOME, most users also will want to download the Location Files for their regions of interest. Location Files contain prepackaged tide and current data and make it easier to work with GNOME. GNOME was developed by the Emergency Response Division (ERD) (formerly the Hazardous Materials Response Division [HAZMAT]) of NOAA's Office of Response and Restoration (OR&R). (From GNOME User’s Manual)
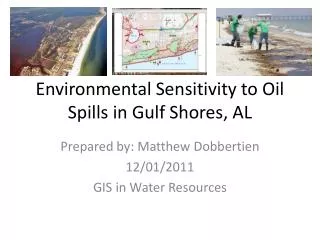
GNOME and ArcGIS The GNOME Toolbox contains extensions and .dll files for displaying GNOME trajectories in ArcView 3.x and ArcMap 9.x. Location Files NOAA has created Location Files for different U.S. coastal areas. Each Location File contains information about local oceanographic conditions that GNOME uses to model oil spills in the area covered by that Location File. Each Location File also contains references (both print publications and Internet sites) to help you learn more about the location you are simulating. (from Galveston Bay Location File User’s Guide Galveston Bay, Texas The class used the Location File for Galveston Bay, an inlet of the Gulf of Mexico, on the southeastern shore of Texas, U.S.A. Galveston Bay's 600 square miles of surface area is commonly divided into four major sub-bays: Galveston Bay, Trinity Bay, West Bay and East Bay. Galveston Bay receives freshwater from three main tributaries (the Trinity and San Jacinto rivers and Buffalo Bayou), and receives saltwater from the Gulf of Mexico.
Screenshot of Galveston Bay Location File Map Example Files With each Location File NOAA provides an Example File with scenarios and questions for practice in understanding parameter changes. A modified version of the Galveston Bay Examples File, which was designed to be easier to follow and more explicit in some directions, was used with students.
Sample Worksheet Use GNOME's Standard Mode and the Galveston Bay Location File to answer the following questions: 1. Tides are an important part of the circulation in Galveston Bay. In this example, you will examine the effects of tides by starting spills at two different times in the tidal cycle. You will run these spills in GNOME twice, once at the beginning of an ebb tide and once at the beginning of a flood tide. (a) First, set up GNOME for a spill that occurs on October 18, 2000 at 0540 (the beginning of an ebb tide). Place a spill in the shipping channel at 29° 30.43’ N, 94° 52.49’ W. Then set a second spill outside of the channel at 29° 31.48’ N, 94° 50.59’ W. Describe the differences in the trajectory and beach impacts between the two spills. Hint: To easily set a spill at a particular location, simply click anywhere on the water area of the map. In the Spill Information window that opens, you can then enter the exact latitude and longitude of the spill. (This method is much easier than moving your mouse around the map and watching its location in the lower left corner of the window!) Note: You will need to use these spills in Example 2 below. Save your settings as a Location File Save (LFS) by choosing Save from the GNOME File menu. (b) Next, , change the spill start times to October 18, 2000 at 1845 (the beginning of a flood tide). Describe the differences in the trajectory and beach impacts between these two spills and the first two.
Screenshot of completed run This screenshot illustrates a completed model Parameters used in this run are listed above Recent additions to GNOME GNOME and Deepwater Incidents: Information to help responders prepare for deepwater incidents. Includes a Data Preparation Sheet for deepwater spill incidents, as well as information about the modifications that GNOME has undergone to make it more useful for deepwater planning and spills. (From Gnome Website)
Evaluation of Lab Activity Evaluation takes place both while students are using GNOME through faculty observation and dialogue, such as posing specific questions about model results, and also later on examination of completed worksheets. One of the best indicators of the success of this lab activity occurred one week after its completion- the students’ response to an oil spill in San Francisco Bay. Coast guard reports were examined in class and students asked the “right” questions- what type of pollutant, tidal and wind conditions, etc. Conclusion The GNOME model is an excellent tool to for use in an undergraduate course. Students interacting with the model demonstrate a high interest in the activity and have a much greater understanding of the complexity of oil spills. References Primary NOAA Office of Response and Restoration Web site. (GNOME and support files may be accessed at this site under the Software and Data Sets heading.) http://response.restoration.noaa.gov/index.php