Download
1 / 20
200 likes | 228 Views
Learn key approaches in measuring pharmaceuticals and personal care products in the environment, including decision-making processes, measurement techniques, and environmental sampling methods. Stay informed on emerging chemical issues and ensuring representative measurements.

E N D
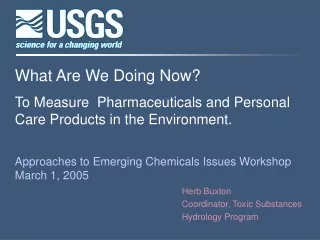
What Are We Doing Now? To Measure Pharmaceuticals and Personal Care Products in the Environment. Approaches to Emerging Chemicals Issues Workshop March 1, 2005 Herb Buxton Coordinator, Toxic Substances Hydrology Program
Key Questions • How do we decide which chemicals to measure? • How do we assure a representative measurement? • How do we decide where to look in the environment? • How do we decide which environmental media to sample (water, sediment, tissue,…). • How do we decide what to monitor?
How do we decide which chemicals to measure? • Mass produced/Quantities used. • Manner used & release pathways. • Anticipated environmental behavior. • Health significance. • Ability to measure. • Potential as indicators/tracers. • Stakeholder priorities.
The Catch! Why are you studying this compound if you don’t know if it’s a health risk? Health effects information to guide environmental occurrence studies. Environmental occurrence information to guide health effects studies.
The Gadolinium Anomaly Gadolinium complex of diethylenetriamine pentaacetic acid Distance (km) Fourmile Creek Gd Conc (µg/L) -0.1 km = 0.004 0.0 km = 0.057 10.6 km = 0.047 Boulder Creek Gd Conc (µg/L) -0.1 km = 0.002 0.0 km = 0.150 10.6 km = 0.041 MRI Contrast Agent Distance (km) Unpublished/Provisional Data (Gromet and others, 1984; Bau and Dulski, 1996; Möller and others, 2002; Verplanck and others, 2003)
USGS Analytical Capabilities • 158 Compounds in Water • 45 Antibiotics • 12 Prescription Drugs • 8 Nonprescription Drugs • 14 Hormones and Steroids • 79 Household and • Industrial Compounds • 83 Compounds in Sediment • 3 Antibiotics • 12 Prescription Drugs • 7 Nonprescription Drugs • 61 Household and • Industrial Compounds
How do we assure a representative measurement? • Consistent field protocols. • Field Quality Assurance. • Laboratory QA. • Agregate QA datasets. • Interlab comparison & coordination.
How do we decide where to look in the environment? Investigating Source Pathways for Environmental Release
Stream Recon 99-00 Testing for Environmental Occurrence Looking in Urban and Agricultural areas. GW Recon 00-01 Are contaminants entering our aquatic environments ? At what Levels? In what Mixtures? spring sump well
Human Waste Pathways • WWTF • CSOs • ISDS • Industrial Disch. • Landfills • Water Reuse.
Animal Waste Pathways Manure (kg/day) Human 1.5 Cow 30 Hog 4 Sheep 1.5 Chicken 0.14 • Animal Feeding Operations • Waste lagoons • Land application • Processing
Source Characterization Studies Liquid and Solid Waste
How do we decide what to monitor? • Transport • Transformation • Persistence • Fate • Health Effects • Ecological • Human (Barber and others, 1995)
Tonalide (musk) in Fourmile Creek, IA SiteWater Sediment # (mg/L) (mg/kg) 1 0.021<25 (-0.1 km) 2 3.12000 (0 km) 4 0.7580 (2.9 km) 5 0.4200 (8.4 km)
Fourmile Ck Tracer Test Leading Edge Peak Dye Injection Trailing Edge
<0.8 E2 Concentrations, ng/L 2.9 2.1 1.4 1.2 Watershed Study - Boulder Creek, CO • Hormone levels elevated downstream of WWTP • Fish community and fish health assessment being • conducted (USGS / University of Colorado) Unpublished/Provisional Data
Biomarkers of Endocrine Disruption in Fish Abnormal Gonad Development Abnormal Blood Chemistry Cellular Abnormalities External Deformities male female
Acknowledgements Dana Kolpin, Iowa City IA dwkolpin@usgs.gov Ed Furlong, Denver COLarry Barber, Boulder CO Mike Meyer, Lawrence KS Steve Zaugg, Denver CO James Gray, Boulder CO Sheridan Haack, Lansing MI Kymm Barnes, Iowa City IA Colleen Rostad, Denver CO Mike Focazio, Reston VA Melissa Schultz, Denver CO Field expertise in 50 District (state) Offices. The USGS Toxics Program: toxics.usgs.gov Emerging Water Quality Issues: toxics.usgs.gov/regional/emc.html