Download
1 / 18
180 likes | 353 Views
A Comparative Dynamic Evaluation of the AURAMS and CMAQ Air Quality Modeling Systems. Steven Smyth a,b , Michael Moran c , Weimin Jiang a , Fuquan Yang a , Wanmin Gong c , and Paul Makar c a ICPET, National Research Council of Canada, Ottawa, ON

E N D
A Comparative Dynamic Evaluation of the AURAMS and CMAQ Air Quality Modeling Systems Steven Smytha,b, Michael Moranc, Weimin Jianga, Fuquan Yanga, Wanmin Gongc, and Paul Makarc aICPET, National Research Council of Canada, Ottawa, ON bNow at Greenhouse Gas Division, Environment Canada, Gatineau, QC cAir Quality Research Division, Environment Canada, Toronto, ON 7th CMAS Conference, Chapel Hill, NC 8 October 2008
Talk Outline Study approach AURAMS vs. CMAQ Harmonized base-case set up and results 4 emission scenarios for dynamic evaluation Results of comparative dynamic evaluation Conclusions 2
Acknowledgements Environment Canada (EC) and U.S. EPA provided emissions inventories Carolina Environment Program provided CMAQ, MCIP, and SMOKE Natural Resources Canada’s PERD program and EC provided funding 3
Approach: What is a “harmonized comparative dynamic evaluation”? Comparative evaluation side-by-side comparison of predictions of two or more models Harmonized comparative evaluation models use same grid and same inputs Dynamic evaluation evaluate model’s predictions of changes in air concentrations or deposition due to changes in either emissions or meteorological inputs 4
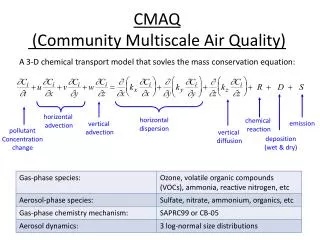
Modelling Systems Compared CMAQ v4.6 SAPRC-99 chemical mechanism; AERO4; NRC PMx post-processor; time-invariant chemical lateral boundary conditions; “Yamo” advection scheme AURAMS v1.3.1b modified ADOM-II gas-phase and ADOM aqueous-phase chemical mechanism; HETV thermodynamic equilibrium sectional representation of PM size distribution (12 bins from 0.01 to 41 µm in Stokes diameter) nine PM chemical components (SO4, NO3, NH4, EC, POM, SOM, CM, SS, H2O) zero-gradient chemical lateral boundary conditions semi-Lagrangian advection scheme 5
Harmonization Aspects Same map projection, domain, and horizontal grid secant polar stereographic projection true at 60°N, North American continental domain, 150x106 grid pts, 42-km spacing Same emissions inventories and emissions processor 2000 Cdn EI, 2001 U.S. EI, 1999 Mexican EI; SMOKE v2.2 BEIS v3.09 Same meteorological input fields from EC’s GEM v3.2.0 operational weather forecast model Same simulation period: July 1-29, 2002 But: AMPP vs. GEM-MCIP met preprocessors; different vertical coordinates and discretization 6
Measurement Data (for 2002) O3 - hourly measurements from: the EC NAPS network (190 sites) and U.S. EPA AQS network (1087 sites) PM2.5 - hourly measurements from NAPS (92 sites) and AQS (262 sites) Speciated PM2.5 – 1-in-3-day 24-h measurements from NAPS (17 sites) and U.S. EPA STN network (205 sites) O3 Measurement Sites PM Measurement Sites 7
Base-Case O3 Performance AURAMS has lower bias Similar levels of error and correlation CMAQ over prediction mainly due to inability in predicting daily lows 8
Base-Case Total PM2.5 Performance AURAMS has lower bias Similar levels of error and correlation 9
Four Emissions Scenarios Increase NOx emissions by 50% (“1.5NOx”) Decrease NOx emissions by 50% (“0.5NOx”) Decrease VOC emissions by 50% (“0.5VOC”) Decrease NOx and VOC emissions by 50% (“0.5NOx+0.5VOC”) 10
(Base Case - “0.5NOx”) NMD Field for O3 (left) and PM2.5 (right) AURAMS CMAQ
(Base Case - “0.5VOC”) NMD Field for O3 (left) and PM2.5 (right) AURAMS CMAQ
Comparison of AURAMS and CMAQ Mean O3 and PM2.5 Concentrations (units of ppbV or μg m-3) for Base and Sensitivity Cases at Measurement Site Locations Only. NMD Values are Percentages. • AURAMS is more VOC-sensitive for O3 and more NOx- and VOC-sensitive for PM2.5 • CMAQ is more NOx-sensitive for O3 • signs of predicted response are different for one species in two scenarios
Comparison of AURAMS and CMAQ Mean Concentrations of Total PM2.5 and Various Major Species (all in units of μg m-3) for Base and Sensitivity Cases at Measurement Site Locations Only. NMD Values Are Percentages.
Gas- and Particle-Phase Coupling Stockwell et al. (1988) found that in low-NOx areas, NOx emission reductions decrease oxidant levels and hence gas-phase SO2 oxidation and p-SO4 formation VOC emission reductions increase oxidant levels and hence gas-phase SO2 oxidation and p-SO4 formation Pun et al. (2008) have suggested that the above changes in oxidant levels will affect p-TOA (via SOA) formation in the same direction as p-SO4 15
Summary and Conclusions (1) O3, total PM2.5, and PM2.5 major species concentration changes resulting from four sets of NOx and VOC emissions scenarios were analyzed for July 2002 paired simulations with harmonized set-ups of the AURAMS and CMAQ AQ modeling systems Such a harmonized comparative dynamic evaluation provides a measure of the uncertainty in the predictions of two important pollutants for policy applications of these AQ modeling systems AURAMS was found to be more VOC-sensitive for O3 whereas CMAQ was more NOx-sensitive AURAMS was found to be more NOx-sensitive and VOC-sensitive for PM2.5 Differences were also evident in the spatial distributions of the predicted changes in O3 and PM2.5 16
Summary and Conclusions (2) NOx emission changes affect p-NO3 but also p-SO4 and p-TOA; VOC emission changes affect p-TOA but also p-SO4 and p-NO3 While the magnitudes of the predicted changes O3 and total PM2.5 varied considerably, the signs of the predicted changes were consistent except for daily minimum O3 for the “1.5NOx” scenario and for total PM2.5 for the “0.5VOC” scenario For the PM2.5 major species, however, differences in the signs of the predicted changes were more common, and these contributed to the total PM2.5 change sign difference for the “0.5VOC” scenario 17