Download

1 / 20
410 likes | 1.07k Views
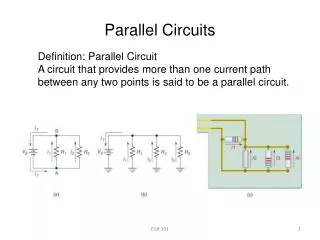
Parallel AC Circuits Analysis. ET 242 Circuit Analysis II. E lectrical and T elecommunication Engineering Technology Professor Jang. Acknowledgement.

E N D
Parallel AC Circuits Analysis ET 242 Circuit Analysis II Electrical and Telecommunication Engineering Technology Professor Jang
Acknowledgement I want to express my gratitude to Prentice Hall giving me the permission to use instructor’s material for developing this module. I would like to thank the Department of Electrical and Telecommunications Engineering Technology of NYCCT for giving me support to commence and complete this module. I hope this module is helpful to enhance our students’ academic performance.
OUTLINES • Introduction to Parallel ac Circuits Analysis • Impedance and Phase Diagram • Parallel Configuration • Current Divider Rule • Frequency Response for Parallel ac Circuits • Phase Measurements Key Words: Parallel ac Circuit, Impedance, Phase, Frequency Response ET 242 Circuit Analysis II – Parallel ac circuits analysis Boylestad2
Parallel ac Networks For the representative parallel ac network in Fig. 15.67, the total impedance or admittance is determined as previously described, and the source current is determined by Ohm’s law as follows: Figure 15.67Parallel ac network. Since the voltage is the same across parallel elements, the current through each branch can be found through another application of Ohm’s law: KCL can then be applied in the same manner as used for dc networks with consideration of the quantities that have both magnitude and direction. I – I1 – I2 = 0 or I = I1 + I2 The power to the network can be determined by P = EIcosθTwhere θT is the phase angle between E and I. ET 242 Circuit Analysis II – Sinusoidal Alternating Waveforms Boylestad3
Parallel ac Networks : R-L Phasor Notation: As shown in Fig. 15.69. Figure 15.68Parallel R-L network. Figure 15.69Applying phasor notation to the network in Fig. 15.68. Figure 15.70Admittance diagram for the parallel R-L network in Fig. 15.68. ET162 Circuit Analysis – Ohm’s Law Boylestad4
Phasor diagram: The phasor diagram in Fig. 15.71 indicates that the applied voltage E is in phase with the current IR and leads the current IL by 90o. Figure 15.71Phasor diagram for the parallel R-L network in Fig. 15.68. ET 242 Circuit Analysis II – Parallel ac circuits analysis Boylestad5
Parallel ac Networks : R-C Phasor Notation: As shown in Fig. 15.73. Figure 15.72Parallel R-C network. Figure 15.73Applying phasor notation to the network in Fig. 15.72. Figure 15.74Admittance diagram for the parallel R-C network in Fig. 15.72. ET 242 Circuit Analysis II – Parallel ac circuits analysis Boylestad6
Parallel ac Networks : R-L-C Phasor Notation: As shown in Fig. 15.78. Figure 15.77Parallel R-L-C network. Figure 15.78Applying phasor notation to the network in Fig. 15.77. ET 242 Circuit Analysis II – Parallel ac circuits analysis Boylestad2
Figure 15.79Admittance diagram for the parallel R-L-C network in Fig. 15.77. ET 242 Circuit Analysis II – Parallel ac circuits analysis Boylestad8
Current Divider Rule The basic format for the current divider rule in ac circuit exactly the same as that dc circuits; for two parallel branches with impedance in Fig. 15.82. Figure 15.82Applying the current divider rule. Ex. 15-16 Using the current divider rule, find the current through each parallel branch in Fig. 15.83. FIGURE 15.83 ET 242 Circuit Analysis II – Parallel ac circuits analysis Boylestad2
Ex. 15-17 Using the current divider rule, find the current through each parallel branch in Fig. 15.84. FIGURE 15.84 Frequency Response of Parallel Elements For parallel elements, it is important to remember that the smallest parallel resistor or the smallest parallel reactance will have the most impact on the real or imaginary component, respectively, of the total impedance. ET 242 Circuit Analysis II – Parallel ac circuits analysis Boylestad10
In Fig. 15.85, the frequency response has been included for each element of a parallel R-L-C combination. At very low frequencies, the importance of the coil will be less than that of the resistor or capacitor, resulting in an inductive network in which the reactance of the inductor will have the most impact on the total impedance. As the frequency increases, the impedance of the inductor will increase while the impedance of the capacitor will decrease. FIGURE 15.85Frequency response for parallel R-L-C elements. ET 242 Circuit Analysis II – Parallel ac circuits analysis Boylestad11
Let us now note the impact of frequency on the total impedance and inductive current for the parallel R-L network in Fig. 15.86 for a frequency range through 40 kHz. FIGURE 15.86Determining the frequency response of a parallel R-L network. ZT In Fig. 15.87, XL is very small at low frequencies compared to R, establishing XL as the predominant factor in this frequency range. As the frequency increases, XL increases until it equals the impedance of resistor (220 Ω). The frequency at which this situation occurs can be determined in the following manner: FIGURE 15.87The frequency response of the individual elements of a parallel R-L network. ET 242 Circuit Analysis II – Sinusoidal Alternating Waveforms Boylestad 12
A general equation for the total impedance in vector form can be developed in the following manner: IL Applying the current divider rule to the network in Fig. 15.86 results in the following: ET 242 Circuit Analysis II – Parallel ac circuits analysis Boylestad13
Equivalent Circuits In a series circuit, the total impedance of two or more elements in series is often equivalent to an impedance that can be achieved with fewer elements of different values, the elements and their values being determined by frequency applied. This is also true for parallel circuits. For the circuit in Fig. 15.94 (a), The total impedance at the frequency applied is equivalent to a capacitor with a reactance of 10 Ω, as shown in Fig. 15.94 (b). FIGURE 15.94Defining the equivalence between two networks at a specific frequency. ET 242 Circuit Analysis II – Parallel ac circuits analysis Boylestad14
Another interesting development appears if the impedance of a parallel circuit, such as the one in Fig. 15.95(a), is found in rectangular form. In this case, There is an alternative method to find same result by using formulas FIGURE 15.95Finding the series equivalent circuit for a parallel R-L network. ET 242 Circuit Analysis II – Parallel ac circuits analysis Boylestad15
Ex. 15-18 Determine the series equivalent circuit for the network in Fig. 15.97. FIGURE 15.98The equivalent series circuit for the parallel network in Fig. 15.97. FIGURE 15.97Example 15.18. ET 242 Circuit Analysis II – Sinusoidal Alternating Waveforms Boylestad16
Phase Measurement Measuring the phase angle between quantities is one of the most important functions that an oscilloscope can perform. Whenever you are using the dual-trace capability of an oscilloscope, the most important thing to remember is that both channel of a dual-trace oscilloscope must be connected to the same ground. Measuring ZT and θT For ac parallel networks, the total impedance can be found in the same manner as described for dc circuits: Simply remove the source and place an ohmmeter across the network terminals. However, For parallel ac networks with reactive elements, the total impedance cannot be measured with an ohmmeter. The phase angle between the applied voltage and the resulting source current is one of the most important because (a) it is also the phase angle associated with the total impedance; (b) it provides an instant indication of whether the network is resistive or reactive; (c) it reveals whether a network is inductive or capacitive; and (d) it can be used to find the power delivered to the network. ET 242 Circuit Analysis II – Parallel ac circuits analysis Boylestad17
In Fig. 15.104, a resistor has been added to the configuration between the source and the network to permit measuring the current and finding the phase angle between the applied voltage and the source current. In Fig. 15.104, channel 1 is displaying the applied voltage, and channel 2 the voltage across the sensing resistor. Sensitivities for each channel are chosen to establishes the waveforms appearing on the screen in Fig. 15.105. FIGURE 15.104Using an oscilloscope to measure ZT and θT. FIGURE 15.105e and vR for the configuration in Fig. 15.104. ET 242 Circuit Analysis II – Parallel ac circuits analysis Boylestad18
Using the sensitivities, the peak voltage across the sensing resistor is Em = (4div.)(2V/div.) = 8 V while the peak value of the voltage across the sensing resistor is VR,(peak) = (2div.)(10mV/div.) = 20 mV For the chosen horizontal sensitivity, each waveform in Fig. 15.105 has a period T defined by ten horizontal divisions, and the phase angle between the two waveforms is 1.7 divisions. Using the fact that each period of a sinusoidal waveform encompasses 360o, the following ratios can be set up to determine the phase angle θ: ET 242 Circuit Analysis II – Parallel ac circuits analysis Boylestad19