Enhancing Migration and Population Statistics: Mid-Year Estimates - ONS Demography Agenda**
260 likes | 371 Views
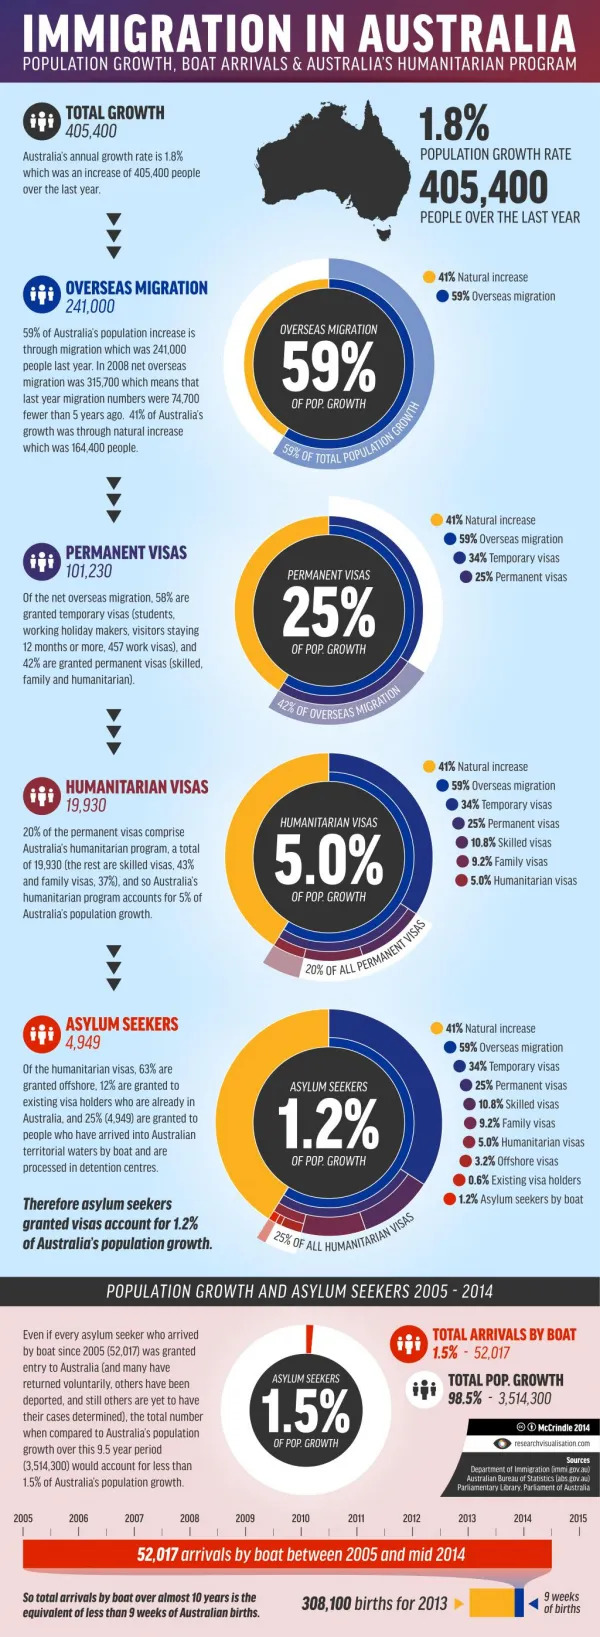
The Office for National Statistics (ONS) is advancing its Migration Statistics Improvement Programme (MSIP) to refine migration data collection and local authority estimates. This mid-year estimates meeting aims to engage local authorities, discuss Phase 2 plans of the MSIP, and summarize recent improvements in migration statistics methodology. Key objectives include enabling user consultation, reviewing methodology adaptations, and ensuring robust data representation at local, regional, and national levels. The meeting will feature presentations, discussions, and provide insights into the evolving landscape of migration data.

Enhancing Migration and Population Statistics: Mid-Year Estimates - ONS Demography Agenda**
E N D
Presentation Transcript
Improving Migration and Population Statistics: Mid-Year Estimates Office for National Statistics Centre for Demography
Agenda • Introductions and Objectives of Meeting 11:00 2. Local Authority presentations 11:15 3. Lunch 12:15 • Summary of Migration Statistics Improvement 12:45 Programme - improvements to methods so far • Plans for phase two of the Migration Statistics 13:00 Improvement Programme 6. Discussion 13:45 7. Close 14:30
Objectives • To contribute to the aim of the cross-government programme to improve migration statistics with particular emphasis on local area migration statistics • To provide local authority users with an opportunity to comment on the improved estimates • To discuss plans for phase two of the Migration Statistics Improvement Programme • To enable more effective user consultation
Migration Statistics Improvement Programme – Phase 1 Nigel Swier ONS Centre for Demography
Overview • Background to the Migration Statistics Improvement Programme (MSIP) • MSIP Phase 1 • Improvements affecting LA estimates • QA & User engagement • Summary
The Challenge • No system of compulsory migration registration • Rapid changes in levels and distribution • Increasingly complex patterns • Estimates required at local authority (LA), regional and national levels
Efforts to improve migration statistics • The 2001 ‘Census gap’ • ONS IMPS Programme (2003) • LA Case Studies • The 2007 improvements package • Major Reviews (2006-2008) • Inter-departmental Task Force on Migration Statistics • TSC Report on ‘Counting the Population’ • Migration Statistics Improvement Programme (2008) • Cross government programme • Led by National Statistician with Ministerial Group
MSIP: Phase 1 • Improved cross-government reporting • Development and access to administrative data sources (DWP, HESA, DSCF) • Improvements to survey sources (IPS, IHS) • New products: • Short-term migration estimates • Migration Indicators • Quarterly IPS estimates • Improvements to LA estimates for the next 3 year finance settlement
Improvements affecting LA estimates • Replacement of 2001 Census distribution to estimate immigration to LA level with a modelling approach incorporating a wide range of data sources • Methodology for distributing emigration to LA level made more robust and consistent with immigration modelling • Data from Higher Education Statistics Agency (HESA) used to improve internal migration estimates by adjusting for uncaptured student migration
Distribution of impact across all LAs 2002 to 2008 Camden has been excluded from this chart
QA & User engagement • ONS Internal Review Groups • Local Insight Reference Panels • Expert Peer Review Group • 2009 Roadshows (June & December) • User Engagement (30 Nov 2009 to 18 January 2010)
Issues raised during user engagement • Student adjustment assumptions • Data used in the international migration models • Use of intermediate geographies • International migration regional totals • Comparisons with other data sources
Summary • Migration has always been difficult to measure accurately and is becoming even more difficult • The remit of the MSIP is to improve migration statistics in the broadest sense • The latest LA estimates are the best possible that could have been produced (although ONS acknowledge they are not perfect) • Phase 1 has delivered other improvements • Phase 1 work on administrative sources provides a platform for further improvements in Phase 2
Migration Statistics Improvement Programme – Plans for Phase 2 Ben Humberstone ONS Centre for Demography
Admin Sources Methods E-borders Phase 2 Workstreams Quality User Engagement
Local Authority X Pop Age Admin Sources Workstream • Key deliverable – plausibility range and contingency adjustment strategy • Quality assessment of admin sources • Assessment of long/short term migrants • Demographic analysis Contingency Adjustment
Key deliverable – improved regional/local authority distribution of long and short term migrants Utilising admin sources to distribute migrants estimated by IPS (national/regional level) Solving the ‘intermediate geography’ issue. IPS Estimate Methods Workstream Children - School Census Workers - Lifetime Longitudinal DB (L2), Migrant Worker Scan, Students - Higher Ed Stats Auth General - Flag 4 Patient Register,
E-Borders Workstream • Key deliverable – Improved international migration estimates • Short term – looking for improvements to weighting of IPS and ‘lead indicators’ for patterns of migration • Medium/long term – development of travel history analysis leading to direct estimation of migration(?)
Other Work • Quality key deliverable – measurement of uncertainty around pop ests at LA level, builds on ‘plausibility ranges’ • Ongoing user engagement – • ‘Roadshows’ in the autumn after the MSIP Programme Board • Quarterly updates and research reports • Further work on student moves utilising microdata
Dependencies • 2011 Census • Demographic Quality Assurance • Measures of long and short term migrants possible for the first time • Local Authority engagement • Beyond 2011 Project • Looking at what might come after the 2011 Census • Assessing the feasibility of a range of options • Comprehensive Spending Review
Next Steps • Review plans for Phase 2 in the light of today’s meeting • Develop detailed plans for submission to the Migration Statistics Improvement Programme Board in September • MSIP Phase 2 Roadshows in the autumn • Delivery of improved methods • Revisions to population estimates? • 2011 Census!
Discussion • To what extent do the plans outlined for Phase 2 address the concerns raised in the first session? • Has anything been overlooked in the plans? • How best can we keep you informed?
The migrant journey and administrative sources E-borders E-borders NIRS (Migrant Worker Scan) Lifetime Labour Market Database Work and Pensions Longitudinal Study Admin Sources PBS HESA Patient Register Change GP School Census Electoral Register Migrant Journey Register with GP Election – register to vote Leave UK Start work/course Move within UK Activities Arrive in UK Dependents start school Apply for a visa (non EEA) Time
Timeline Improved estimates and products What do we get? Good Census QA Minimal gap Use of best sources Census Results Understanding Census results Further development Improvements to administrative sources Phase 1 delivery Future population estimate systems Development of methods (linking) e-Borders statistical delivery e-Borders specification e-Borders methods Revisions Rebased estimates May 2010 2011 2012 2013
Context - Change Net migration Natural change