Download
1 / 12
120 likes | 261 Views
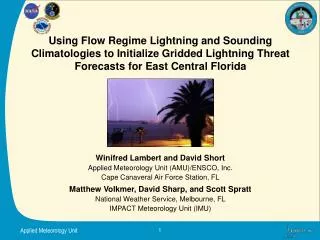
Using Flow Regime Lightning and Sounding Climatologies to Initialize Gridded Lightning Threat Forecasts for East Central Florida. Winifred Lambert and David Short Applied Meteorology Unit (AMU)/ENSCO, Inc. Cape Canaveral Air Force Station, FL Matthew Volkmer, David Sharp, and Scott Spratt

E N D
Using Flow Regime Lightning and Sounding Climatologies to Initialize Gridded Lightning Threat Forecasts for East Central Florida Winifred Lambert and David Short Applied Meteorology Unit (AMU)/ENSCO, Inc. Cape Canaveral Air Force Station, FL Matthew Volkmer, David Sharp, and Scott Spratt National Weather Service, Melbourne, FL IMPACT Meteorology Unit (IMU) 1
Presentation Outline • Describe the daily lightning threat index map • How and why the map is created • Motivation for developing lightning climatologies • Two types of climatologies • Case Study • Summary 2
Lightning Threat Index • Cloud-to-Ground (CG) Lightning Threat Index Map at NWS Melbourne • Issued daily by 1200 UTC • 5 color-coded threat levels at 5 x 5 km • Probability of thunderstorms • Expected amount of CG activity • Created on AWIPS/GFE • Adjusted by assessing observations, spatial patterns of thunderstorm formation parameters 3
Lightning Threat Indices • Threat levels depend on • Probability of thunderstorms • Expected amount of CG • Range of CG probabilities and amounts within each level 4
Motivation 24-hour CG Probability for Southwest Flow (Stroupe 2003) • NWS MLB requested: • Spatial climatologies of CG probability and amount to create first guess field • Climatological soundings to help adjust first guess field • Climatologies stratified by synoptic flow regime • Previous work shows connection between flow regime and CG occurrence • 1200 UTC soundings used to determine flow-regime-of-the-day 5
Flow Regimes • 1000–700 mb average wind direction 1200 UTC soundings at MFL / TBW / JAX • Combination of 3 directions determined flow regime • 7 flow regimes: • Ridge south of MFL • Ridge btwn MFL/TBW • Ridge btwn TBW/JAX • Ridge north of JAX • Ridge over Florida Panhandle • Northwest flow • Northeast flow Jacksonville (JAX) Atlantic Ocean Cape Canaveral Air Force Station (XMR) Tampa (TBW) Gulf of Mexico MLB CWA Miami (MFL) 6
Data • Warm season (May – September) 1989 – 2004 • Data/code provided by FSU and NWS TAE to create spatial lightning climatologies • Hourly lightning data grids created from NLDN data • Flow regime dates of occurrence • Code to read and process data • Soundings for vertical profile climatologies • 1200 UTC MFL, TBW, JAX • 1000 UTC XMR (Time due to operational requirements) • Flow regime dates used to stratify grids and soundings 7
CG Probability Mean # CG Climatologies Spatial: Gridded values create first-guess field Soundings: Average vertical profiles for 4 sites Cape Canaveral Air Force Station (XMR) First Guess Lightning Threat Index 8
Sample Case: 13 July 2006 • Ridge north of Florida • SE flow regime • Lightning more likely on west coast • Forecasters start with first-guess threat map • Climatological soundings adjust first guess map 9
13 July 2006 XMR Climatology / 10 Z Sounding TBW Climatology / 12 Z Sounding PW KI TT Obs: 1.65” 6 42 Climo: 1.81” 28 44 PW KI TT Obs: 1.98” 32 44 Climo: 1.73” 27 43 10
13 July 2006 Lightning Threat Index Forecast Verification First Guess Field Forecaster-Adjusted Field Observed Lightning 11
Summary • Created climatologies based on flow regime: • Gridded CG probabilities and number of strikes • Morning soundings at 4 Florida locations • 1200 UTC MFL – TBW – JAX • 1000 UTC XMR • Gridded climatologies used to create a first-guess lightning threat index map • Soundings compared to observations to determine deviation from mean Lightning Threat Map:http://www.srh.noaa.gov/mlb/ghwo/lightning.shtml IMU: http://www.srh.noaa.gov/mlb/amu_mlb/IMU2.html AMU:http://science.ksc.nasa.gov/amu 12