Download

1 / 9
90 likes | 262 Views
Oakland Unified School District 2012-2013 Enrollment Presentation v11. November 14, 2012 Presented by: Tony Smith, Ph.D., Superintendent of Oakland Unified School District David Montes de Oca , Executive Director of Quality Community Schools Development. OVERVIEW. PART I:.

E N D
Oakland Unified School District2012-2013 Enrollment Presentation v11 November 14, 2012 Presented by: Tony Smith, Ph.D., Superintendent of Oakland Unified School District David Montes de Oca, Executive Director of Quality Community Schools Development
OVERVIEW PART I: Trends : Results Initiatives (Expanding Grades, STEM, Transitional Kinder) PART II: PART III: Restructuring PART IV: District – Charter Enrollment Dynamic PART V: Enrollment Projections
PART I: TRENDS : RESULTS What is the enrollment* of the Oakland Unified School District this year? Total Non-SDC: 34,789 Total SDC: 1,473 Total w/ SDC: 36,262 District & OUSD Authorized Charter Enrollment Over-Time * Enrollment Data 2012-13: September 24, 2012 referred to as the Day 20 Count 2000-2001 through 2011-12 Enrollment based on – CBEDS Reporting (Includes SDC) 3 * * Note: Charter data is OUSD Authorized Charters ONLY, based on historical data record.
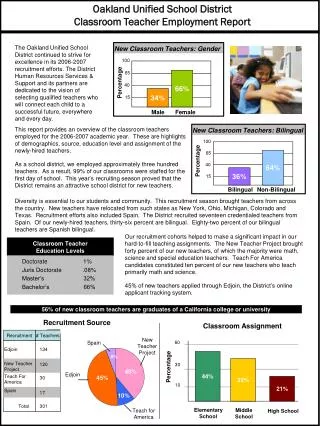
PART II: District Initiatives: Expanding Grades, STEM • Graph A: All schools approved for grade level expansion met or exceeded 2012-13 enrollment targets for 6th grade. • Graph B: Over past two years an increasing number of 6th grade students new to OUSD helps off-set the ongoing decline in retention of 5th grade students within OUSD transitioning to 6th grade. • 5th Grade Retention = % of District 5th graders that remain in District for the following 6th grade year. • 6th Grade Progression = ratio of District 6th grade class compared to prior year District 5th grade class. B. A. All West Oakland STEM Corridor Schools serving grades K-8 experienced an increase in Entry Grade Enrollment (K, 6) for 2012-13. Additionally, McClymonds High School experienced 10.1% increase in enrollment school-wide. C. 4 * Data Used: 2011-12 & 2012-13 based on Day 20 Count
PART II: District Initiatives: Transitional Kindergarten Transitional Kindergarten enables OUSD to continue serving over 200 students affected by California's new Kindergarten age requirements, while also supporting our youngest students' developmental growth and preparedness for traditional Kindergarten. 5
PART III: Restructuring Percent of student loss from closed elementary schools is slightly lower than national average closure loss (20%). Total student loss represents small portion of total enrollment loss for OUSD in 2012-13. Remained in OUSD: 508 (81.02%) Left OUSD: 119 (18.98%) Consolidated High Schools gained as many students into OUSD at grades 10-12 as was lost from OUSD at 9-11. A. Change from June 10, 2012 to September 24, 2012 B. Gained as of Sept. 24, 2012 134 Students 6 * Data Used: Comparison based on Aeries SIS Loss / Gain between June 10, 2012 and September 24, 2012
PART IV: District and Charter Enrollment Dynamic Comparison between 2011-12 and 2012-13 District and charter school enrollment change. Most of the District enrollment losses* can be accounted for by gains in charter schools** with the exception of a few grade levels, particularly at secondary. * Data Used: The Day 20 Count 2011 and 2012 ** Based on attendance accounting reported September, 2011 and September, 2012. 7
PART V: Enrollment Projections • Timing of program changes has implications for Enrollment Projections. Decisions made after February impact budgets, staffing and fall consolidations; because they are driven by enrollment projections. • EXAMPLE: • 2012-13* Grades 1st – 8th Enrollment projection difference: 695 • 2012-13** Grades 1st – 8th Enrollment change based on AIPCS II Renewal/Expansion (OUSD) & Lazear Charter Conversion (ACOE): 663 8 * Date Used: The Day 20 Count 2012 ** Based on attendance accounting reported September, 2011 and September, 2012.