Download

1 / 12
120 likes | 285 Views
IE486 Work Analysis & Design II. Lab 4 – Upper Limb Assessment Supplementary Notes on Evaluation of Analysis Tools March 23, 2007 Vincent G. Duffy, IE & ABE. Job & Worksite Analysis. Today we’ll consider Reliability & Validity In the context of Job & Worksite Analysis

E N D
IE486 Work Analysis & Design II Lab 4 – Upper Limb Assessment Supplementary Notes on Evaluation of Analysis Tools March 23, 2007 Vincent G. Duffy, IE & ABE
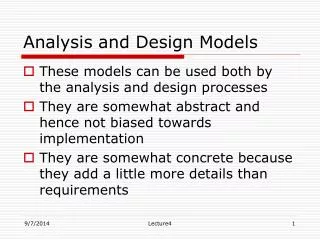
Job & Worksite Analysis • Today we’ll consider Reliability & Validity In the context of Job & Worksite Analysis • We’ll consider how to evaluate the tools used in Job & Worksite Analysis • See also Ch. 8 in • A. Freivalds 2004 Biomechanics of the Upper Limbs, CRC Press, Boca Raton, FL. • Previously: • We considered the analysis tools used for the lower back • Related to Ch. 11 in Wickens on Biomechanics
In section 8.2.2 (reliability), you see calculations for a correlation coefficient test and re-test.see equation. 8.2In the previous notes today, note that the Cronbach Alpha calculation is a variation of a correlation analysisIn section 8.2.4 it should be again noted that… Accuracy is related to validityPrecision is related to reliabilityAlso, consider sensitivity
See figure 8.2 re: probability of occurrence vs. risk score (level of symptoms) • Consider : • a. true positives • b. false positives • c. false negatives • d. true negatives • In the subsequent calculations. These allow you to calculate/consider sensitivity, and accuracy (though many assessment tools do not report these values).
a. true positives b. false positivesc. false negatives d. true negatives • Sensitivity is the ability of the assessment tool to correctly identify injurious jobs • Sensitivity = true pos./ (true pos. + false neg.) • Sensitivity =[a/(a+c)] • Predictive value – ability to predict which jobs will result in future MSDs • Predictive value = a/(a+b) • Accuracy is the degree of agreement between assessment tool and ‘gold standard’ (best tool). • Accuracy= (a+d)/(a+b+c+d) • (multiply all of the above 100 to get percent)
8.2 Job & Worksite Analysis A new risk assessment tool is being developed to identify the risk for WRMSDs. In a study, 300 workers are screened by physicians for WRMSDs, yielding 100 confirmed cases. The risk assessment tool yields 200 positives, of which 50 are true positives. Calculate the sensitivity, specificity, and predictive value of this tool.
8.2 a. true positives b. false positivesc. false negatives d. true negatives • Total 300 workers, 50 TP; by subtraction… • FN=100-TP=50; therefore a total of 100 TP +FN, 200 TP+FP from given; • Also by subtraction: FP= 200-TP=150; • Total 300=TP+FP+TN+FN=300; therefore • TN=300-TP-FP-FN=300-50-150-50=50 • Calculate the sensitivity, specificity, and predictive values;
8.2 a. true positives b. false positivesc. false negatives d. true negatives • Calculate the sensitivity, specificity, and predictive values; • Total 300 workers, 50 TP, by subtraction; FN=100-TP=50; therefore a total of 100 TP +FN, 200 TP+FP from given; Also by subtraction: FP= 200-TP=150; • Total 300=TP+FP+TN+FN=300; therefore TN=300-TP-FP-FN=300-50-150-50=50 • Sensitivity=TP/(TP+FN)= • Specificity=TN/(TN+FP)= • (note correction on p.372) • Predictive value= TP/(TP+FP)=
8.2 a. true positives b. false positivesc. false negatives d. true negatives • Calculate the sensitivity, specificity, and predictive values; • Total 300 workers, 50 TP, by subtraction; FN=100-TP=50; therefore a total of 100 TP +FN, 200 TP+FP from given; Also by subtraction: FP= 200-TP=150; • Total 300=TP+FP+TN+FN=300; therefore TN=300-TP=FP-FN=300-50-150-50=50 • Sensitivity=TP/(TP+FN)=50/(50+50)=.5 (50%) • Specificity=TN/(TN+FP)=50/(50+150)=.25 (25%) • Predictive value= TP/(TP+FP)=50/(50+150)=.25 (25%)
8.3 Job and worksite analysis • A new test is being compared with a ‘gold standard’ measurement with the following results: Gold Standard (best tool) New test + - + 22 2 - 8 73
8.3 • A new test is to be compared with a ‘gold standard’ measurement tool: Gold Standard New test + - + 22 2 - 8 73 Sensitivity= TP/(TP+FN)= Specificity= TN/(FP +TN)=
8.3 • A new test is to be compared with a ‘gold standard’ measurement tool: Gold Standard New test + - + 22 2 - 8 73 Sensitivity= TP/(TP+FN)=22/(22+8)=.733 Specificity= TN/(FP +TN)=73/(2+73)=.973