Download

1 / 8
80 likes | 261 Views
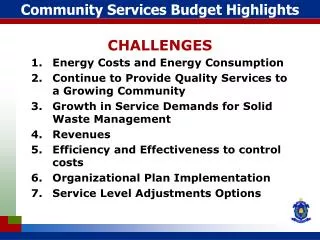
Community Services Budget Highlights. CHALLENGES Energy Costs and Energy Consumption Continue to Provide Quality Services to a Growing Community Growth in Service Demands for Solid Waste Management Revenues Efficiency and Effectiveness to control costs Organizational Plan Implementation

E N D
Community Services Budget Highlights CHALLENGES • Energy Costs and Energy Consumption • Continue to Provide Quality Services to a Growing Community • Growth in Service Demands for Solid Waste Management • Revenues • Efficiency and Effectiveness to control costs • Organizational Plan Implementation • Service Level Adjustments Options
Community Services Budget Highlights CHALLENGE Energy Costs and Energy Consumption RESPONSE • Honeywell Project Completed and monitoring underway. • Optimization Study of Magna Operations • Analysis of shift to Spot Market for electricity and time shifting consumption • Rodan load shifting program for Magna • Corporate Energy Reduction Team
Community Services Budget Highlights CHALLENGE Continue to Provide Quality Service Levels to a growing Community RESPONSE • Tender for contractor to maintain Regional boulevards so staff can concentrate on parks (proposed budget under growth category) • Review park areas for naturalization with public input • Optimize facility utilization (see service level options) • Winter Maintenance Review recommendations
Community Services Budget Highlights CHALLENGE Growth in Service Demands in Solid Waste Management including Participation Rates/Cost for SSO and Yard Waste RESPONSE • Renewed Promotion of Composting Bins • Report on Options for bag limits for garbage in January • Higher emphasis on enforcement of Bag Limits • Optimize 3 stream collection system on trails to reduce costs
Community Services Budget Highlights CHALLENGE Revenue RESPONSE • Service Pricing Policy for sports facilities in year 2 of 5 year plan and Non Resident Fees Policy implemented • User Fee increase totaled 12% over 2008 forecasts • Rationalize revenue projections for RAS and Facility rentals with historical averages. • Recreation & Culture stretch target for ice rentals ($90,000). • Increase Eng. Fees for developers from 2 to 2.75% of cost of subdivision services. • Charge additional Eng. Fees for developments exceeding normal completion timeframes.
Community Services Budget Highlights CHALLENGE Efficiency and Effectiveness to control costs RESPONSE • Staff call out and overtime policies • Sidewalk Snowplowing shift to regular hours service (generally 7:00 am) • Operations Center Project Manager in-house secondment
Community Services Budget Highlights CHALLENGE Organizational Plan Efficiency Implementation RESPONSE • One Layer of Management eliminated • Centralized Capital Projects Team created and Manager to be hired early in 2009 • Financing for Engineering Services rationalized between Capital project financing and Developer fees • Plan being implemented within existing Community Services Budget
Community Services Budget Highlights Service Levels Options • Close Community Centre to public and provide minimum maintenance (Net Savings $30,000) • RJT Complex open at 3 pm on Tues. and Thurs. from Sept. to June. Where possible programs shifted (Net Savings $58,000) • RJT Complex open at 4 pm on every weekday from September to June. Where possible Programs shifted to other facilities (Net Savings $145,000) • Close Rogers Wading Pool (Net Savings $19,000) • Close Lions Rink (Net Savings $67,000) Note: Details and Impact Assessment available