Download
1 / 61
630 likes | 684 Views
Explore the intricate relationship between glucose transport, metabolism in diabetes, and cancer. Understand the role of insulin signaling pathways and glucose transporters in maintaining blood sugar levels. Discover how organs are involved in glucose metabolism and how disruptions can lead to diabetes.

E N D
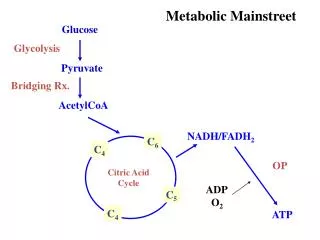
Glucose transport and glucose metabolism in diabetes and cancer Xiaozhuo Chen, October 8, 2015
2008 1994 2000 2008 1994 2000 <4.5% 4.5-5.9% 6.0-7.4% 7.5-8.9% >9.0% <14.0% 14.0-17.9% 18.0-21.9% 22.0-25.9% >26.0% Age-adjusted Percentage of U.S. Adults Who Were Obese or Who Had Diagnosed Diabetes Obesity (BMI ≥30 kg/m2) Diabetes CDC’s Division of Diabetes Translation. National Diabetes Surveillance System available at http://www.cdc.gov/diabetes/statistics
Center for Disease Control and Prevention (CDC) Predicts that about 1/3 of children born in 2000 in the US will develop type 2 diabetes. Predicted break-down statistics: Hispanics - females 53%, Hispanic males 45%, Blacks - females 49%, males 40%, Whites – females 31%, males 27%
Numbers of people with diabetes (in millions) for 2000 and 2010 (top and middle values, respectively), and the percentage increase. Zimmet et al. Nature 414:782-787 (2001)
The prevalence of type 2 diabetes mellitus among Chinese in Hong Kong, Singapore, Taiwan and Mauritius, compared with that in the People's Republic of China6 Zimmet et al. Nature 414:782-787 (2001)
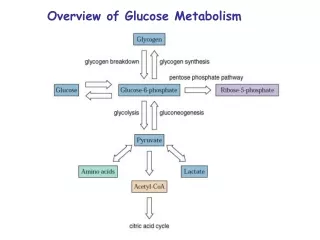
Organs involved in glucose metabolism and in diabetes Moller D. Nature 414:821-827 (2001)
Positive and negative regulations (signals) in glucose metabolism between tissues Adipose (fat) tissue is now considered as an endocrine organ
Comparison of normal glucose metabolism with glucose metabolism in diabetes Type 2 diabetes Lingapa & Farley, Physiological Medicine, 2000
Why Insulin and Insulin Signaling Pathway are Needed? Reality: Unpredictable cycle of feeding and then starvation that ensues between meals Solution: Store nutrients in the forms that can be used as energy sources during periods of fasting – glucose, amino acids and fatty acids as nutrients, and glycogen, protein, and lipids as storage macromolecules Insulin: Master hormone that regulates the energyhomoestasis Most potent anabolic hormone known
b-Pancreatic Islet Cells are the Source of Insulin b-cells with insulin Pancreatic islet a-cells with glucagon
How Relatively Stable Blood Glucose Concentration is Maintained ? After a meal Before a meal Hepatocytes Liver
The idealized diagram shows the fluctuation of blood sugar (red) and the sugar-lowering hormone insulin (blue) in humans during the course of a day containing three meals. In addition, the effect of a sugar-rich versus a starch-rich meal is highlighted.
Insulin Actions Fast actions Slow actions
Insulin undergoes extensive posttranslational modification along the production pathway. Production and secretion are largely independent; prepared insulin is stored awaiting secretion. Both C-peptide and mature insulin are biologically active. Cell components and proteins in this image are not to scale.
Computer-generated image of six insulin molecules assembled in a hexamer, highlighting the threefold symmetry, the zinc ions holding it together, and the histidine residues involved in zinc binding. Insulin is stored in the body as a hexamer, while the active form is the monomer.
Insulin release from pancreas oscillates with a period of 3–6 minutes
Structure of Insulin Receptor Insulin binding domain Transmembranedomain Intracellular tyrosine kinase domain Pierre De Meyts and Jonathan Whittaker
P P Glut4 Insulin-mediated glucose transport signaling pathway Insulin IR a a b b IRS PI3K Akt
Insulin P Insulin-mediated glucose transport signaling pathway Glucose Uptake Assay IR a glucose a b b P IRS PI3K Akt
P P Glut4 Insulin-mediated glucose transport signaling pathway Insulin IR a a b b IRS PI3K Akt
Insulin P Insulin-mediated glucose transport signaling pathway Glucose Uptake Assay IR a glucose a b b P IRS PI3K Akt
Insulin P Glut4 Insulin-mediated signaling pathway Glucose uptake assay 2 deoxy-D-[3H]-glucose IR a a glucose b b P IRS PI3K Akt
Structural model of the major insulin-responsive glucose transporter GLUT4
Three steps that provide functional divergence for insulin signaling
PI-3 Kinase • Type 1A PI-3K in adipocytes • Heterodimer – p85 regulatory subunit and a p110 catalytic subunit • IRS1 and/or IRS2 bind PI-3K via SH-2 domain on p85, which then activates p110 • 6 isoforms of p85 regulatory subunits – tissue specific expression • Function of PI-3K is to convert phosphotidylinositol 4,5-bisphosphate (PIP2) to PI 3,4,5-triphosphate (PIP3) • Activates three Ser/Thr kinases – Akt/PKB, atypical PKC isoforms and phosphoinositide-dependent kinases (PDK-1 and PDK-2)
Three steps that provide functional divergence for insulin signaling
Akt / PKB (Protein kinase B) • 3 isoforms, Akt-2 is most highly expressed in adipocytes • Phosphorylation and activation of Akt involve 3’ phosphoinositides and the action of PDK • Contains PH domain • The downstream targets of Akt/PTB have not been identified. • Required for insulin-mediated glucose transport • Involved in multiple other insulin responses • Represents an important mechanism for “cross-talk” between PI-3K pathway and other pathways regulating gene transcription and mitogenic effects.
What is Insulin Resistance? • Impaired insulin-mediated glucose uptake in peripheral cells • Impaired suppression of gluconeogenesis by the • liver • 3. Impaired suppression of lipolysis in adipocytes
Summary Insulin receptor (IR) is a pre-formed tetrameric transmembrane protein with two a- and two b- subunits linked by disulfide bonds. Extracellular a-subunits of IR form the insulin binding site and intracellular b subunits possess tyrosine kinase activity Insulin binding to the a subunits of IR triggers a conformational change in the b subunits and activates the tyrosine kinase activity of the b subunits. Each b-subunit trans-phosphorylates Tyr residues on the other b-subunit (autophosphorylation). Activated IR phosphorylates insulin receptor substrate proteins (IRSs)
Summary II Phosphorylated tyrosine on IRS serves as docking site for PI-3K, and moves PI-3K from cytosol to the inner side of plasma membrane PI-3K converts PIP2 into PIP3 by phosphorylation PIP3 moves Akt (PKB) next to membrane bound protein kinases and protein kinases phosphorylates and activates Akt Akt indirectly activates GLUT4, inducing the translocation of GLUT4 from cytoplasm to the plasma membrane and triggering transport of glucose into the adipocyte (also muscle) cells
Summary III (Common themes in signal transduction) Tyrosine kinase receptors for most growth factors Docking (often SH2 domain to phosphorylated Tyr) for protein-protein interaction near receptor Multiple protein factors (often kinases) for signal amplification and potential crosstalk with other regulatory pathways May have alternative pathway(s) for further fine tuning for the signal Signal inhibitors and attenuators such as phosphatases and/or serine/threonine kinases coexist with activators Temporal and spatial regulation of signal
Positron Emission Tomography (PET) Scan Tracer: Glucose analogue – 18F-fluorodeoxyglucose Esophageal cancer
Hallmarks of cancer 2000 Oncogenic signaling Resistance of apoptosis Loss of tumor suppression New blood vessel formation Invasion and metastasis Telomere and telomerase Cell 2000; 100:57-70.
Hallmarks of cancer - 2010 Cancer metabolism Immuno-evasion Cancer genomics Inflammation Cell 2011;144:646-74
More than 90% of all cancers show increased glucose uptake and glucose metabolism (18)F-FDG ((18)F-fluoro-2-deoxyglucose) uptake on positron emission tomography (PET) Used for diagnosis, prognosis Liver metastases of a colorectal tumor http://en.wikipedia.org/wiki/Positron_emission_tomography http://en.wikipedia.org/wiki/File:PET-MIPS-anim.gif http://pubchem.ncbi.nlm.nih.gov/summary/summary.cgi?sid=4237470
Glucose metabolism and the Warburg effect Warburg effect – Upregulated aerobic glycolysis and lactate production even in the presence of O2 in cancer cells. O2 O2 Otto H. Warburg German Biochemist (1883-1970) Gatenby, et al. Nat. Rev. Cancer 2004; 4, 891-899. http://www.nobelprize.org/nobel_prizes/medicine/laureates/1931/#
Glucose metabolism and the Warburg effect Warburg effect – Upregulated aerobic glycolysis and lactate production even in the presence of O2 in cancer cells. Nature Reviews Cancer 4, 891-899, 2004
Molecular mechanisms driving the Warburg effect. Normal cell Tumor cell Cairns, et al., Nat. Rev. Cancer11, 85-89 (2011).