Download
1 / 16
160 likes | 387 Views
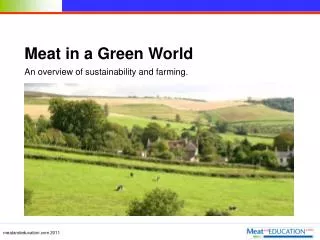
It’s a green world. Energy flow Part 1. Starter. List as many animals as possible in 2 minutes List as many plants as possible in 2 minutes . Energy flow. Learning objectives. Success criteria. Explain how the efficiency of energy transfers explains the limited length of food chains

E N D
It’s a green world Energy flow Part 1
Starter List as many animals as possible in 2 minutes List as many plants as possible in 2 minutes
Energy flow Learning objectives Success criteria • Explain how the efficiency of energy transfers explains the limited length of food chains • Explain how the efficiency of energy transfers explains the shape of pyramids of biomass Students should be able to: • Calculate the efficiency of energy transfers
Food chains and food webs What is a food chain? A simple diagram showing the feeding relationships between some plants and animals What do the arrows represent? Energy transfer What is a food web? A diagram showing how all the food chains in an area link together
Food chains and food webs What is a producer? Plants are producers because they produce food What are consumers? All other organisms in a food chain are consumers because they get their food from other organisms
Task 1 Complete worksheet B4e1 : Aquarium ecosystem • 1 algae snail newt catfish diatoms fresh water mussel newt catfish diatoms fresh water mussel catfish algae snail catfish diatoms water fleas goldfish • 2 Check students’ food webs, particularly direction of arrows • 3 Algae, diatoms • 4 Two from: snail, newt, catfish, mussel, water flea, goldfish
Understanding pyramids of numbers In a pyramid of numbers, the length of each bar represents the number of organismsat each trophic level in a specified area. As a single tree can support many organisms, this food chain produces an unbalanced pyramid.
Understanding pyramids of biomass In a pyramid of biomass, the length of each bar represents the amount of organic matter – biomass– at each trophic level in a specified area. At each trophic level, the amount of biomass and energy available is reduced, giving a pyramid shape.
Task 2 Copy fig3 on p73 of the textbook
energy used for growth (output) efficiency = energy supplied (input) How do you calculate efficiency? Energy efficiency can be calculated using the following equation: For example, if grass receives 1,000,000 kJ of energy from the Sun and uses 20,000 kJ of energy for growth, then: 20,000 kJ efficiency = 1,000,000 kJ = 0.02 = 2%
Task 3 Complete B4e4 : Energy transfer • 1 (1022 + 1909) ÷ 3056 = 0.959 convert into a percentage by multiplying by 100 = 96% • 2 Efficiency= energy used ÷ energy supplied × 100 = 125 ÷ 3056 × 100 = 4% • 3 There is less heat loss and less energy used for movement • 4 Energy is not used to maintain a high body temperature
Energy flow Learning objectives Success criteria • Explain how the efficiency of energy transfers explains the limited length of food chains • Explain how the efficiency of energy transfers explains the shape of pyramids of biomass Students should be able to: • Calculate the efficiency of energy transfers