
Monitoring Clinical Trials: Expected vs. Actual Randomizations in the National Drug Abuse Treatment Network
This research outlines the National Drug Abuse Treatment Clinical Trials Network's (CTN) use of standardized web-based Trial Progress Reports (TPR) to track the progress of ongoing clinical trials. The reports provide real-time monitoring of recruitment, retention, treatment exposure, and quality assurance. By comparing expected and actual randomizations, the TPR empowers investigators and treatment providers to assess performance and identify areas for improvement. This tool enhances oversight for both individual sites and overall protocol performance, improving the quality of substance abuse research.

Monitoring Clinical Trials: Expected vs. Actual Randomizations in the National Drug Abuse Treatment Network
E N D
Presentation Transcript
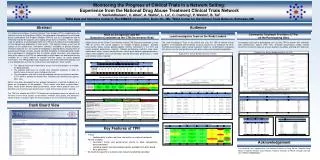
Expected vs. Actual Randomizations, By CTP Expected vs. Actual Randomizations, Overall CTP1 CTP2 CTP3 CTP4 CTP6 CTP5 CTP8 CTP7 CTP9 CTP10 CTN-9996 CTN-9997 CTN-9998 CTN-9999 Acknowledgement This research was supported by the National Institute on Drug Abuse, National Drug Abuse Treatment Clinical Trials Network, National Institutes of Health, through Contract No. HHSN271200900034C. Monitoring the Progress of Clinical Trials in a Network Setting:Experience from the National Drug Abuse Treatment Clinical Trials Network P. VanVeldhuisen1, C. Allen1, A. Wahle1, L. Lu1, C. Cushing2, P. Wakim2, B. Tai2 1NIDA Data and Statistics Center 2, The EMMES Corporation, Rockville, MD; 2NIDA Center for the Clinical Trials Network, Bethesda, MD Abstract Audience The National Drug Abuse Treatment Clinical Trials Network (CTN), established by the National Institute on Drug Abuse (NIDA), has developed a comprehensive set of web-based standardized Trial Progress Reports (TPR) to use as a management tool to effectively monitor the progress of on-going clinical trials in real-time. These reports track the progress of each protocol within the CTN from the date of first randomization to final closeout and publication of main results. The content includes areas from all aspects of the clinical trials: recruitment, retention, availability of primary outcome, treatment exposure (i.e., the number of medication or placebo doses actually taken, or psychosocial therapy sessions actually attended, divided by the corresponding number that a participant is expected to take or attend), quality assurance, and regulatory. Most of the reports in the TPR are updated daily and all reports are web-based and are available on a secure website to provide real-time access to critical protocol information. The TPR provides both a big-picture view of the NIDA CTN protocols and a very detailed view to meet the needs of the varied audience, which include: Community Treatment Providers (CTPs) as the Participating Sites NIDA as the Sponsor and the Executive Committee as the CTN Governance Body Lead Investigative Team as the Study Leaders The Lead Investigative Team of the clinical trial uses the TPR to monitor overall progress of the protocol and to identify areas of concern on an individual site level. Example presentations below include expected number of randomizations compared with actual, and site-level performance with green, yellow and red color designations. Investigators and staff at participating sites use the TPR to monitor their individual site’s performance against other sites. Example presentations below include recruitment, treatment exposure, primary outcome availability, and long-term follow-up. NIDA’s Center for the Clinical Trials Network and the CTN Executive Committee use the TPR to assess the overall progress of multiple on-going protocols. Example presentations below include protocol-specific monthly recruitment in the CTN and overall protocol performance statistics. Protocol performance statistics show color-coded boxes across various monitored areas, where green denotes good performance, yellow where problem areas are identified, and red where poor performance is noted and remedial actions required. • The sponsor and study leadership to assess the overall progress of multiple on-going protocols. • The protocol lead teams to monitor their respective protocols in order to identify areas of concern on an individual site level. • The investigators and staff at each participating community treatment provider (CTP) within a protocol to monitor their individual site’s performance against other sites. Metrics have been developed for key protocol components to provide feedback at a glance on the progress of the protocols. These metrics have been assigned color-codes, where green denotes good performance, yellow where problem areas are identified, and red where poor performance is noted and remedial actions required. The TPR has allowed the NIDA CTN leadership and protocol teams to monitor and intervene in the critical aspects of recruitment, retention, data quality, and treatment implementation to improve upon the overall quality of the research being conducted. Dash Board View Key Features of TPR • Timing • Updated daily to allow real-time information on status of protocols • Format of tables • Consistent format and performance criteria to allow comparisons across protocols • Individual reports and consolidated reports available from dash board • All in pdf format • No treatment-specific or outcome data (beyond availability) provided


