Download
1 / 28
280 likes | 463 Views
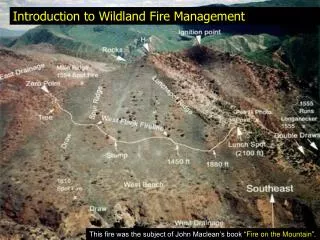
From Ignition to Spread Wildland Fire Forecasting and Color Maps. Haiganoush K. Preisler Pacific Southwest Research Station USDA, FS. Managing fire on populated forest landscapes October 20 - 25, 2013 Banff International Research Station For Mathematical Innovation and Discovery.

E N D
From Ignition to Spread Wildland Fire Forecasting and Color Maps Haiganoush K. Preisler Pacific Southwest Research Station USDA, FS Managing fire on populated forest landscapes October 20 - 25, 2013 Banff International Research Station For Mathematical Innovation and Discovery
Overview • Uncertainties in Fire danger maps • 1-7 day forecasts • Seasonal (1-month ahead) forecasts • 1-year ahead • 1-2 hours ahead (will not be covered in this talk -requires a statistical model of fire growth. Future research.) • Maps of risk that incorporate loss to societal or ecological values
It is hard to perform goodness-of-fit analyses of these maps Need probability models to perform validation
(8/23/2013) EROS = Earth Resources Observation System
Pr[Fire size > C | ignition ] = f x,y,t( FPI ) FPI = Fire Potential Index is a moisture-based vegetation flammability indicator. = f(living vegetation greenness, 10-h dead fuel moisture)
(8/23/2013) Alternative color legend By using the alternative color legend we are able to note the amount of uncertainty in the maps AND at the same time demonstrate the goodness-of-fit of the forecasts
Fire occurrence data from MTBS: Monitoring Trends in Burn Severity Satellite imagery of burned area for fires > 500 acres (in East) and > 1000 acres (in west) starting from 1984 – present • Explanatory variables: 1) location 2) day-in-year 3) Forecasted FPI values for upcoming 7-days evaluated daily on a 9km2 grid cell surrounding ignition pt. • Model: spatially and temporally explicit logistic regression at 1kmx1kmxday grid cells.
A legend that includes some uncertainty. Goodness-of-fit analysis still to be done.
Seasonal Forecast (one-month ahead) Large Fire Forecast Probabilities for the month of August, 2013 based on explanatory variable values up to July 31, 2013 • Explanatories used: • Moisture Deficit • ENSO, TEMP • Elevation • Lightning Scenario Anthony Westerling UC Merced
Goodness-of-fit for the one-month-ahead forecasts based on large fire occurrences (>200ha) in California and Nevada between 1985-2008 Observed Fraction of large fires Predicted Probability of a large fire
Same as previous slide but with the Predicted values grouped Observed Fraction of large fires Predicted Probability of a large fire (Grouped)
Alternative legend demonstrating expected amount of uncertainty and degree of goodness-of-fit of the forecasts to historic data
Forecasting one-year-ahead fire risk 1) Use season specific historic averages based on historic large fire occurrences: Historic large fire occurrence from MTBS data
Forecasting one-year-ahead fire risk 2) Use a model that includes a trend over the years Data – Corsica & Sardinia (Alan Ager and Michele Salis)
Risk to social, economic and ecological values • Alan Ager (WWETAC) • Western Wildland Environmental Threat Assessment Center • Color maps to help managers with their fuel treatment decisions • Maps based on fire risk AND on #people/homes/type of habitat at risk • Produce maps by simulating the process from ignition to spread
The process to be simulated Spatial-temporal Marked Point Process {x,y,t,u} Likelihood for discretized process (km×km×day)
Once an ignition location and fire size is simulated then fire perimeters/scars may be simulated using a fire growth model Simulated (red) Observed (orange) fire perimeters (Farsite, FSPro) Mark Finney
Distribution of Fire Sizes Observed vs Simulated Quantiles Although simulated fire sizes seem to be a good approximation of observed fire sizes, goodness-of-fit of fire growth models still needs to be done.
Simulated fire perimeters/scars are then overlapped with other polygons with high value (e.g., owl habitat; old growth trees; houses) The number of houses, owl habitat or people being affected by each simulated fire are then used, together with the simulated total area burned in a given region to produce risk maps based on a measure of loss of interest.
Number of people exposed vs total area burned by simulated fires ignited on FS land 95th % Number of people exposed (power of 10) Grouped total area burned (power of 10)
Criteria based on expected burn area and #people affected There is a large amount of variation in this color map too. Both spatial (between districts) and temporal (between years) variation as seen in the boxplots of the next slide.
Total area burned per district per year (power of 10) 5 4 3 2 Boxplot colors match the colors in the previous map
References • D.R. Brillinger, H.K. Preisler, and J.W.Benoit. (2003). Risk assessment: a forest fire example. In Science and Statistics: A Festschrift for Terry Speed. D.R. Goldstein [Ed.]. pp: 177- 196. • Preisler, H.K., D.R. Brillinger, R.E. Burgan, and J.W. Benoit. (2004) Probability based models for estimation of wildfire risk. Journal of Wildland Fire, 13, 133-142 • Brillinger, D. R., Preisler, H. K., and Benoit, J. (2006) "Probabilistic risk assessment for wildfires. Environmetrics, 17 623-633. • Preisler,H.K., Westerling, A.L. (2007). "Statistical model for forecasting monthly large wildfire events in western United States". Journal of Applied Meteorology and Climatology 46, 1020-1030. • Preisler, H.K.,Chen, S.C. Fujioka, F., Benoit, J.W. and Westerling, A.L. (2008). "Wildland fire probabilities estimated from weather model-deduced monthly mean fire danger indices". International Journal of Wildland Fire17: 305-316. • Preisler, H.K., Burgan, R.E., Eidenshink, J.C, Klaver, J.M., Klaver, R.W. (2009) ‘Forecasting distributions of large federal-lands fires utilizing satellite and gridded weather information’ International Journal of Wildland Fire 18, 517-526. • Preisler, H.K., Westerling, A.L. Gebert, K. and Munoz-Arriola, F. and Holmes, T. (2011) ‘Spatially explicit forecasts of large wildland fire probability and suppression costs for California.’ International Journal of Wildland Fire. 20:508-517 • Preisler, H.K. and A.A.Ager. (2012) ‘Forest fire models’ in A. H. El-Shaarawi and W. Piegorsch (eds.) Encyclopedia of Environmetrics Second Edition, John Wiley and Sons Ltd: Chichester, UK.