Download
1 / 46
460 likes | 633 Views
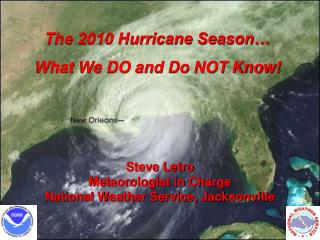
The 2010 Hurricane Season… What We DO and Do NOT Know!. Steve Letro Meteorologist in Charge National Weather Service, Jacksonville. 2010 Hurricane Season Outlook: What Does it Mean for You?. Outline. Watch / Warning Issuance Times Tropical Cyclone Public Advisory Format

E N D
The 2010 Hurricane Season… What We DO and Do NOT Know! Steve Letro Meteorologist in Charge National Weather Service, Jacksonville
Outline • Watch / Warning Issuance Times • Tropical Cyclone Public Advisory Format • Saffir-Simpson Hurricane Scale Changes • Size of Tropical Cyclone Forecast Cone • 2010 Tropical Season Outlook
Tropical Storm Watches and Warnings Tropical Storm WatchTropical storm conditions (sustained winds of 39 to 73 mph) are possible within the specified coastal area within 48 hours Tropical Storm Warning Tropical storm conditions (sustained winds of 39 to 73 mph) are expected somewhere within the specified coastal area within 36 hours
Hurricane Watches and Warnings Hurricane WatchHurricane conditions (sustained winds of 74 mph or higher) are possible within the specified coastal area. Because hurricane preparedness activities become difficult once winds reach tropical storm force, the hurricane watch is issued 48 hours in advance of the anticipated onset of tropical-storm-force winds Hurricane Warning Hurricane conditions (sustained winds of 74 mph or higher) are expected somewhere within the specified coastal area. Because hurricane preparedness activities become difficult once winds reach tropical storm force, the hurricane warning is issued 36 hours in advance of the anticipated onset of tropical-storm-force winds
Track Errors Cut in Half Last 15-20 Years!
1970 48-hour Forecast Point over Jacksonville, Florida Average Error = 300 nautical miles Let’s Try And Put That Into Perspective…
Now 48-hour Forecast Point over Jacksonville, Florida Average Error = 80 nautical miles (~ 70% Reduction!)
NHC Public Advisory 1. Basic Format Not Changed Since The 1960s 2. Plain-Language Intended for “Rip and Read” Broadcast Media. 3. Not Easily to Parse Sections Until A Summary Section became Tabular Format in 2009 4. Must Dig Through Several Paragraphs of Text to Find Basic Storm Info 5. Storm Hazards and Impacts Are Buried Near Bottom
New Public Advisory Format Section Headers Added Storm Info First Changes to Watches/Warnings in the Current Advisory are Highlighted Bulleted Summary of All Watches/Warnings in Effect
New Public Advisory Format Section Headers Discussion of Forecast Motion, Intensity and Other Pertinent Info Storm Hazards and Impacts Shown by Type
The All-New Saffir-Simpson Scale No More Flooding Impacts! No More Storm Surge! No More Central Pressure!
Saffir-Simpson Hurricane Wind Scale Surge, Rainfall, and Pressure Fit the Scale Like a Square Peg in a Round Hole KATRINA (3) IKE (2) CHARLEY (4) http://www.nhc.noaa.gov/aboutsshs.shtml
Biscayne Bay Average 11.7’ NWS WFO Jacksonville CWA/AOR Average 12.8’
Water Totals Above the AVERAGE Cell Ground Level Think of it as a First Guess Inundation Water Totals Above the Datum (NGVD 27 or NAVD 88)
Error Cone Update Slight Reduction in Size Due to Lower Track Errors
The Main Weather Patterns Expected To Influence The 2010 Season: • Atlantic MultiDecadal Oscillation (AMO) • El Nino/La Nina (ENSO) • Surface Atmospheric Pressures • Madden-Julian Oscillation (MJO)
The Atlantic Multi Decadal Oscillation… A Rearrangement Of Atlantic Sea Surface Temperatures (SST) In 25-40 Year Cycles… Has Been In A Warm Phase Since 1995… With A Corresponding Increase In Hurricane Activity Avg. # Hurricanes = 8.0 Atlantic Multi Decadal Oscillation (AMO) Index Avg. # Hurricanes = 4.7
Warm Sea Surface Temperatures (SST) Are A Prime Ingredient In Hurricane Formation… Providing The Necessary “Fuel” To Power The Storm SST Departures From Normal: 1995-2008 Warmer Than Normal SST Departures From Normal: 1981-1994 Near, Or Cooler Than Normal Average Number of Hurricanes: 8.0 Average Number of Hurricanes: 4.7
The Impact Of Sea Surface Temperature: Inactive vs. Active Seasons 1997 2004-2005 3 Hurricanes, 1 Major 2 Year Avg: 12 Hurricanes, 6.5 Majors
North Atlantic SST Annual Anomalies… Remember The 25-40 Year Cycle? We’re Not Nearly Done! 1 2009-2020 1995-2008 ? 1926 1969 0.5 0 - 0.5 1925 1970 1994 -1 1900 1910 1920 1930 1940 1950 1960 1970 1980 1990 2000 2010 2020
Current Sea Surface Temperature (SST) Departures From Normal
This Is A Comparison Of Oceanic Heat Content, or Hurricane “Fuel” Between 2009 and 2010 At The Start Of The Season Ocean Heat Content Is A Much Better Indicator Of Heat Potential Available Than Simple Sea Surface Temperatures June 1, 2009 June 1, 2010
El Niño versus La NiñaThe Two Phases Of ENSO El Niño causes extra thunderstorm development over the central and eastern equatorial Pacific. This causes a response in the atmosphere over the Atlantic basin of increased shear and sinking air, causing a drier and more stable atmosphere. Upper winds La Niña causes a reduction and westward shift in thunderstorms. This forces the maximum sinking air to be located over the eastern Pacific and allows air to rise more freely over the Atlantic basin, in addition to less shear. Upper winds
Wind Shear Changes In Wind Speed & Direction With Height
Wind Shear During June-July of 10 ENSO (El Nino vs La Nina) Events. El Niño Tends To Create Stronger Shear Across The Tropics Shear During La Niña Seasons Tends To Be Much Weaker
ENSO Index Since June 2008 2008: 8 Hurricanes 5 Majors 3 US Landfalls 2009: 3 Hurricanes 2 Majors 0 US Landfall El Nino Less Favorable More Favorable We Can’t Count On El Nino To Help Us Out This Year! La Nina
IF The Evolution Of This Event Does Continue As The Forecasts Indicate… Peak Of Hurricane Season El Nino La Nina …The Typical Expected Impacts Would Include More, And Stronger Storms, Especially Those Forming In The Deep Tropics
Sea-Level Pressure • Known to influence hurricanes for at least 70 years. • Pressure is a proxy for multiple qualities in the atmosphere. • Lower pressures are linked to less sinking, which leads to a more moist atmosphere. • Higher pressures in the subtropical high linked to stronger winds, and cooler water temperatures through increased upwelling.
Composite Map Of June-July Anomalous Surface Pressures During 10 Active Hurricane Seasons Higher Than Normal Lower Than normal
Another Player In Town… • During The Recent Winter and Spring, Two Other Atmospheric Oscillations…The North Atlantic Oscillation (NAO) and The Arctic Oscillations Were At Record Negative Values. • These Oscillations Influence The Strength And Position Of The Atlantic/Bermuda High Which Can Influence Where Storms Go. • Since These Oscillations Have Never Shown Such Extreme Values… It Makes It Very Difficult to Infer Their Ultimate Impacts During The Hurricane Season Itself.
The Record Low AO/NAO Led To Well Below Normal Pressures In The East Atlantic This Spring… Leading To Less Upwelling Along The African Coast and Warmer SST’s
Good News… Maybe… Pressures Across The Atlantic Basin Have Been More Normal Recently
Madden-Julian Oscillation • Discovered in the early 1970s by Roland Madden and Paul Julian. • An eastward propagating wave that circles the globe in about 40-50 days involving tropical convection. • Detected in the Outgoing Longwave Radiation (OLR) and wind fields across the tropics. • Later papers showed that it is an important modulator of TC activity, especially in the Pacific Ocean.
MJO Effects in the Atlantic Basin • The MJO Can Lose Much Of Its Strength Before Entering The Atlantic Basin. • In Addition, The MJO Is Weakest During The Late Summer, Near The Peak Of Atlantic Activity. • Western Part Of The Basin Most Strongly Affected • The Atlantic Basin Is Most Active When Tropical Convection Is Suppressed In The Central Pacific Ocean And Enhanced In The Indian Ocean.
The MJO And Tropical Cyclone Genesis Points Most Genesis Points Are Near Or Behind The Upper- Level Divergence Center (Green Shading). Unfortunately, The MJO Has Very Little Predictability Beyond 1-2 Weeks.
The Madden Julian Oscillation… • Individual MJO Events Are… Unfortunately… Unpredictable Beyond About 20 Days, In Onset, Strength, or Longevity. • It’s Also Unclear Exactly What Role The Interaction With A Dissipating El Nino May Play. • The MJO Must Be Watched Closely… Unusually Strong and Long Lasting MJO Events Are Often Accompanied By Lower Shear and Other Atmospheric Factors That Favor Tropical Cyclone Development
With That In Mind…And For What It’s Worth… Here’s The 2010 Outlook • NAMED STORMS:14-23 • HURRICANES:8-14 • MAJOR HURRICANES:3-7 • NET TROPICAL CYCONE ACTIVITY 155-270% • U.S. STRIKES ? • U.S. HRCN STRIKES: ? • MAJOR U.S. HRCN STRIKES ?
Consider The 1992 Hurricane Season… Only 6 Named Storms… But One Of Them Was Andrew!
27 “Named” Storms • 15 Hurricanes • 7 Major Hurricanes Put It Another Way… Let’s Look At The Record 2005 Hurricane Season.. What Was The Big Hurricane That Impacted The Daytona Beach Area In 2005? Answer: There Weren’t Any… For Us, 2005 Was A “Quiet” Season!
The Lesson??? Those Numbers Are Nice, But Without Knowing Where They Are Going To Go… They Don’t Really Mean Much… And We Don’t Know That!
Above/Below NormalDoes it Really Matter ?? • It Only Takes One Storm • If our Area is Hit, it’s a “Bad” Year! • 2007 Was Supposedly A “Quiet” Season.? It’s Doubtful The People Of Belize Who Were Hit By Two Category Fives Would Agree! • We Must Prepare Every Year As Though This Will Be Our Year!!
The End! www.srh.noaa.gov/jax Steve Letro: 904-741-4411 (office) 904-294-1594 (cell)