Download

1 / 10
100 likes | 202 Views
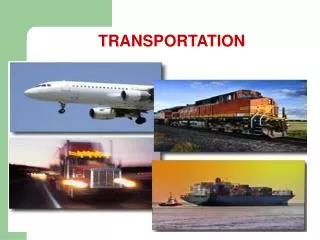
This project aims to analyze the carbon footprint of Washington University's transportation systems, including ground transportation and student air travel. By estimating emissions from commuting and parking, the study provides insights to reduce the university's environmental impact. The analysis covers data on student zip codes, distances flown, commuting modes, and parking emissions, offering recommendations for sustainability improvements. The results highlight trends in transportation emissions and suggest strategies for mitigating carbon footprint growth.

E N D
Transportation Michal Hyrc, Eric Tidquist, William Koury & Ryan Henderson
Objectives • To better understand the carbon footprint of Washington University by: • Improving estimates from previous projects about ground transportation • Analyzing carbon intensive transportation that was not previously looked at, such as student air travel • Estimate emissions due to underground or surface parking on a per spot basis
Approach & Methodology Flying • Based analysis on data about students’ home zip codes or countries from 1991 provided by the university • Calculated distances flown by students annually using two methods • Distances to the actual zip codes • Distances to airports near particular zip codes • Multiplying the students and distance per student, found the total passenger miles flown by students annually • Converted passenger miles to a Carbon Footprint • Since the data provided was very detailed, in depth analysis is possible Commuting • Based analysis on data on student and faculty/staff school zip codes from a similar project conducted in 2009 • Calculated distances commuted (either by walking/biking, using MetroLink, using MetroBus, driving alone, or carpooling), taking into account highway versus city driving differences • Found total miles traveled by each mode of transportation • Converted passenger miles to a Carbon Footprint • Found Upper Bound, Lower Bound, and Best Guess for total carbon emissions from commuting at Washington University
Results 2009
Results Parking Analysis
Summary & Conclusions • The best estimate for Wash U transportation carbon footprint is ~40,000 metric tons of CO2 annually • This number is probably an underestimate, as it does not include faculty air travel • The transportation footprint of Wash U has been steadily increasing over the last 20 years • The increase of the aviation commute footprint is driven by less in-state students and more international, particularly Asian, students • Underground parking emits more carbon dioxide than surface parking • To reduce the transportation footprint, we recommend the University • Merging fall and thanksgiving break to reduce flight emissions • Trying to reduce the number of people that drive to work by themselves