Download
1 / 17
170 likes | 434 Views
FOREST AND SHRUB BIOMASS ANALYSIS CAL FIRE. Overview of M ethods and Results. Mark Rosenberg Fire and Resource Assessment Program California Department of Forestry and Fire Protection November, 2012. SB 1122 (Rubio, 2012). Fire Threat Treatment Area (FTTA). Overview

E N D
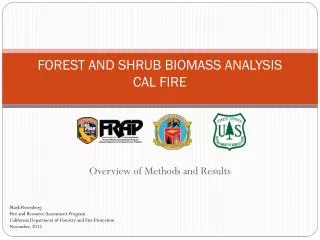
FOREST AND SHRUB BIOMASS ANALYSISCAL FIRE Overview of Methods and Results Mark Rosenberg Fire and Resource Assessment Program California Department of Forestry and Fire Protection November, 2012
SB 1122 (Rubio, 2012) Fire Threat Treatment Area (FTTA) Overview • Directed Electrical Utilities to get 250 MW capacity from community scale bioenergy projects • ~ 50 Megawatts from sustainable forest management in the Fire Threat Treatment Area (FRAP 2005) • FRAP defined Fire Threat Treatment Areas Based on Fire Threat analysis and areas available for removal. ~ 50% of FTTA are on Public Lands. • Fire Threats are dynamic and maps need to be updated periodically
Presentation Overview • Outline methods, data and assumptions used to map Fire Threat Treatment Areas (FTTA) and estimate biomass • Present Biomass (BDT) and Capacity (MW) estimates based on FRAP 2005 results • Next steps for FRAP sustainable forest management assessments
Data Inputs • Existing Vegetation Maps (CALVEG) from CAL FIRE and USFS-RSL • Forest Inventories (FIA) PNW • Fire Threat and Fire Rotation (FRAP 2003) • Management Data and Other Sustainability Constraints • Model Assumptions (to derive annual harvest estimates)
Estimating Fire Behavior Fuel Ranking Methodology Green Line = 8’ flame length; Red line = 4’ flame length
Estimating Fire Frequency Fire Rotation (Frequency) • Very High: (probability of a fire is 1% per year or greater) • High: (probability of a fire is 0.33% - 1% per year) • Moderate: (probability of a fire is less than 0.33% per year)
Index of Fire Threat • Fire Threat • Index of expected fire frequency and fire behavior. • High Frequency + High Severity = High Fire Threat • 48% of California is classified High, Very High or Extreme Fire Threat • Widespread and adjacent to many Communities
Estimate of Technically Available Lands (FRAP 2005) Available Lands • Forest and Shrub Vegetation Types • Private and Other Public Lands • Slopes <30 percent • Not in Reserves • Not in Stream Management Zones • Not in Coastal Sage Scrub Habitat • USFS Lands • Slopes < 35 percent • Not in Wild and Scenic River areas • Not in Wilderness Areas • Not in Special Interest Areas • Not in Research Natural Areas
Fire Threat + Available Lands = FTTA Technically Available Forest and Shrublands Fire Threat Fire Threat Treatment Areas • Standing technical biomass: • 182 M BDT (Total) • 89 M BDT Non-Merchantable • 14 million Acres in FTTA
Forest Biomass Resources Sources of Biomass • Logging slash (branches, tops, and other materials removed from trees during harvest) • Forest thinning (for wildfire threat reduction, ecological purposes, or stand improvement) • Lumber mill waste from merchantable saw logs (sawdust, planer shavings, and trim ends) • Standing shrub biomass http://frap.fire.ca.gov/publications/BIOMASS_POTENTIALS_FROM_CA_FOREST_AND_SHRUBLANDS_OCT_2005.pdf
Modeled Fire Threat Treatment Area (Prescriptions) Annualizing Potentials From FTTA • Privately owned forests: • Hazard reduction thinning every 25 years • Final rotation harvest once in 70 years. • Public lands: • Hazard reduction thinning entry at 67 years • A final rotation harvest once every 100 years. http://frap.fire.ca.gov/publications/BIOMASS_POTENTIALS_FROM_CA_FOREST_AND_SHRUBLANDS_OCT_2005.pdf
Results (FRAP 2005) • Annual technical: 3.1 million BDT/y in FTTA • Treat 500,000 Acres/y • 300k on Private forest lands, • 100k on USFS forest lands and • 100k on Shrub lands • 5-year average Harvest: 1.4 million BDT/yannual potential from timber harvest (1999-2003) • Total new biomass : 4.3 million BDT/y (FTTA + Average Harvest) • ~ 750 MW at 20% conversion efficiency • ~ 5.6 million MWH/y (energy) at 85% capacity factor http://frap.fire.ca.gov/publications/BIOMASS_POTENTIALS_FROM_CA_FOREST_AND_SHRUBLANDS_OCT_2005.pdf
Annual potential biomass (BDT) based on 25 mile neighborhood in the FTTA http://frap.fire.ca.gov/publications/BIOMASS_POTENTIALS_FROM_CA_FOREST_AND_SHRUBLANDS_OCT_2005.pdf
Sustainable Forest Management • Sustaining the viability of ecological, social and economic systems now and into the future • Resource supply: Growth meets or exceeds mortality and removals • Economical: sustainable from economic perspective based upon return on investments (supply, transport, generation costs) • Environmentally: continues to provide ecological services for habitat, water, air, carbon etc.
How do we reach Sustainable Forest Management? • Implement appropriate management practices guided by Forest Practice Act (FPA) and sustainability goals • Use forestland mapping and monitoring at appropriate frequency and scale track growth and removals • Determine impacts of changes and evaluate implications for sustainability • Adaptive management to address needed course changes
FRAP Biomass Sustainability ModelNext Steps: • AB 1504, 2010 – Carbon added to Z’bergNejedly Forest Practice Act • Updated biomass estimates • Evaluate Forest Practice Rules ability to protect carbon throughout the life cycle – current forest, future forests, and wood products • Scale and Intensity of harvest at different price points paid for Biomass material
Thank You Mark Rosenberg Fire and Resource Assessment Program CAL FIRE (916)445-5366 Mark.Rosenberg@fire.ca.gov