Download
1 / 70
700 likes | 858 Views
K a n n o n. Agenda. A Introduction B National and Marketplace Trends C Higher Education Trends D Instructional Faculty Trends E Colleges in Transition F Ferrum College G Ferrum Freshman Segmentation H Enrollment Competitive Set I Operations. H.

E N D
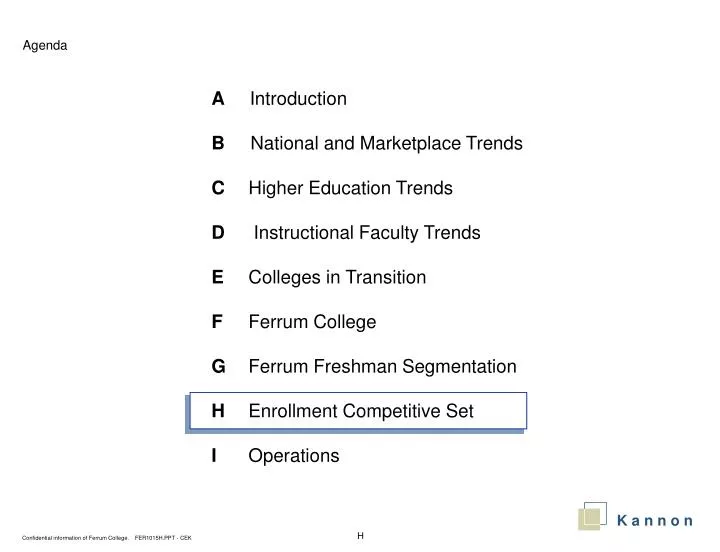
K a n n o n Agenda A Introduction B National and Marketplace Trends C Higher Education Trends D Instructional Faculty Trends E Colleges in Transition F Ferrum College G Ferrum Freshman Segmentation H EnrollmentCompetitive Set I Operations H Confidential information of Ferrum College. FER1015H.PPT - CEK
Enrollment Competitive Set … Introduction • When defining Ferrum College’s competitive set, consideration should be given to two factors – stage at which competing and location of competitor. Factors to Consider When Defining An Enrollment Competitive Set Competitive Factor Stage at Which Competing Location of Competitor • Rationale • In the pre-enrollment stages of the recruiting process, Ferrum College competes with a wide array of schools under active consideration. • However, after enrolling at Ferrum College, some students transfer to another school; therefore, these schools also compete for Ferrum students • Historical data has shown that about 80% of applicants come from Virginia. • Additionally, Ferrum College’s PDA, which consists of 29 Virginia counties and independent cities, accounts for nearly four out of ten matriculating students. • Consequently, schools in the PDA or the SDA within Virginia are likely to be more appealing to Ferrum applicants and a greater source of competition.
Enrollment Competitive Set … Degree of Competition • These two factors become dimensions by which enrollment competitors can be classified as primary, secondary, or tertiary. Criteria for Evaluating Degree of Enrollment Competition FER105H01.xls
Enrollment Competitive Set … Stage Which Compete • Starting with the first dimension, Ferrum College faces enrollment competition throughout all stages of the freshman recruiting process. Conceptual Process of Recruiting College Freshman Competition Competition Competition Competition Ferrum College Ferrum College Ferrum College Ferrum College Awareness Built Materials Sent Admit/Decline Decision Sent If Admit, Decision on Enrollment Inquiries Made Applications Sent If Enroll, Decision to Stay
Enrollment Competitive Set … Stage Which Compete • Data shows that the enrollment competitive pool is very diverse in the early stages when potential students are sending out college applications. Application Overlap with Other Colleges* Note*: Number of cross-applicants shown are the number of Ferrum College admitted students applying to the listed college. Figures do not include applicants who were not admitted to Ferrum College. Source: The College Board, 1995 FER105H02.xls
Enrollment Competitive Set … Stage Which Compete Application Overlap with Other Colleges (continued)* Note*: Number of cross-applicants shown are the number of Ferrum College admitted students applying to the listed college. Figures do not include applicants who were not admitted to Ferrum College. Source: The College Board, 1995 FER105H02.xls
Enrollment Competitive Set … Stage Which Compete Application Overlap with Other Colleges (continued)* Note*: Number of cross-applicants shown are the number of Ferrum College admitted students applying to the listed college. Figures do not include applicants who were not admitted to Ferrum College. Source: The College Board, 1995 FER105H02.xls
Enrollment Competitive Set … Stage Which Compete • Virginia Tech and Radford emerge as leading enrollment competitors when focusing on 5% or more of admitted students among cross-applicant schools. Percent of All Admitted Students Among-Cross Applicants, 1995* Note*: Showing only those colleges which captured 5% or more of admitted Ferrum College freshman. Source: The College Board, 1995
Enrollment Competitive Set … Stage Which Compete • However, the competitive set narrows by the time potential students are choosing between acceptances from Ferrum College and other schools. Colleges Attended by Non-Enrolling Students* Note*: Number of non-enrolling students shown are the number of Ferrum College admitted students who enrolled in the listed college Source: The College Board, 1995 FER105H03.xls
Enrollment Competitive Set … Stage Which Compete Colleges Attended by Non-Enrolling Students (continued)* Note*: Number of non-enrolling students shown are the number of Ferrum College admitted students who enrolled in the listed college Source: The College Board, 1995 FER105H03.xls
Enrollment Competitive Set … Stage Which Compete • Virginia Tech and Radford again emerge as leading enrollment competitors when focusing on schools who won 3% or more of Ferrum admitted students. Percent of Students Admitted to Ferrum College but Enrolled Elsewhere, 1995* Note*: Showing only those colleges which captured 3% or more of admitted Ferrum College freshman. Source: The College Board, 1995
Enrollment Competitive Set … Stage Which Compete • Ferrum College also competes with schools after the enrollment process has been completed; some students transfer to another school. Subsequent Enrollment of Previously Enrolled Ferrum Students* Note*: Showing only those colleges which captured 1% or more of previously enrolled Ferrum College students, 1997 to 2001. Source: National Student Clearinghouse, 1997 to 2001 FER105H14.xls
Enrollment Competitive Set … Stage Which Compete Subsequent Enrollment of Previously Enrolled Ferrum Students (continued)* Note*: Showing only those colleges which captured 1% or more of previously enrolled Ferrum College students, 1997 to 2001. Source: National Student Clearinghouse, 1997 to 2001 FER105H14.xls
Enrollment Competitive Set … Stage Which Compete Subsequent Enrollment of Previously Enrolled Ferrum Students (continued)* Note*: Showing only those colleges which captured 1% or more of previously enrolled Ferrum College students, 1997 to 2001. Source: National Student Clearinghouse, 1997 to 2001 FER105H14.xls
Enrollment Competitive Set … Stage Which Compete • Virginia Community Colleges and Radford University emerge as leading enrollment competitors when focusing on the subsequent enrollment of previously enrolled Ferrum College students. Percent of Previously Enrolled Ferrum College Students, 1997 to 2001* Note*: Showing only those colleges which captured 3% or more of previously enrolled Ferrum College students. Source: National Student Clearinghouse, 1997 to 2001
Enrollment Competitive Set … Stage Which Compete • Of the Virginia community colleges winning previously enrolled Ferrum students, VA Western and Northern VA community colleges won the highest percentage. Subsequent Enrollment in Virginia Community Colleges, by College* Note*: The Virginia Community College system also includes Eastern Shore, Mountain Empire, Paul D. Camp, and Virginia Highlands, each of which represented less than 1% of previously enrolled Ferrum students. Source: National Student Clearinghouse, 1997 to 2001 FER105H15.xls
Enrollment Competitive Set … Stage Which Compete • Across community colleges outside Virginia, the states of Florida and Maryland won the highest percentage of previously enrolled Ferrum students. Subsequent Enrollment in Other Community Colleges, by State Source: National Student Clearinghouse, 1997 to 2001 FER105H15.xls
Enrollment Competitive Set … Location of Competitor • The second dimension focuses on schools located in Ferrum College’s PDA or SDA within Virginia. • Over 80% of Ferrum matriculating students are from Virginia. • Additionally, Ferrum College’s PDA accounts for nearly four out of ten matriculating students. • Ferrum’s SDA represents one-half of all matriculating students. • Therefore, colleges that are located within the Ferrum College PDA or SDA within Virginia are more likely to be appealing to Ferrum students and a greater source of competition. Source: Geographic and Geodemographic Analysis for Ferrum College, College Marketing Technologies, Inc, 2000
Enrollment Competitive Set … Location of Competitor • Ferrum’s PDA consists of 29 Virginia counties and independent cities. Definitions of Ferrum College Drawing Areas Source: Geographic and Geodemographic Analysis for Ferrum College, College Marketing Technologies, Inc, 2000 FER105H05.xls
Enrollment Competitive Set … Location of Competitor • Roanoke, Lynchburg and Averett colleges emerge as leading enrollment competitors when focusing on schools located in Ferrum’s PDA. Competitive Colleges Within Ferrum’s Drawing Areas Source: The College Board, 1995; Geographic and Geodemographic Analysis for Ferrum College, 2000 FER105H17.xls
Enrollment Competitive Set … Location of Competitor Competitive Colleges Within Ferrum’s Drawing Areas (continued) Source: The College Board, 1995; Geographic and Geodemographic Analysis for Ferrum College, 2000 FER105H17.xls
Enrollment Competitive Set … Location of Competitor Competitive Colleges Within Ferrum’s Drawing Areas (continued) Source: The College Board, 1995; Geographic and Geodemographic Analysis for Ferrum College, 2000 FER105H17.xls
Enrollment Competitive Set … Primary Competitors • Looking across the two enrollment competitive dimensions, colleges meeting the primary criteria can be considered the primary competitive set. • Secondary Criteria • Represents 2% or more of all admitted students among cross-applicants, and/or • Have won away 2% or more of Ferrum’s non-enrolling students, and/or • Have won away 2% or more of previously enrolled Ferrum students, and • Are located in Ferrum’s PDA or SDA outside Virginia • Primary Criteria • Represents 5% or more of all admitted students among cross-applicants, and/or • Have won away 3% or more of Ferrum’s non-enrolling students, and/or • Have won away 3% or more of previously enrolled Ferrum students, and • Are located in Ferrum’s PDA or SDA within Virginia Primary Competitive Set • Tertiary Criteria • Represents 1% or less of all admitted students among cross-applicants, and/or • Have won away 1% or less of Ferrum’s non-enrolling students, and/or • Have won away 1% or less of previously enrolled Ferrum students, and • Are located in Ferrum’s PDA, SDA, or TDA Secondary Competitive Set Tertiary Competitive Set
Enrollment Competitive Set … Primary Competitors • Therefore, 11 schools, plus the Virginia community colleges, emerge as primary enrollment competitors of Ferrum College. Ferrum College’s Primary Enrollment Competitors Source: The College Board, 1995; Geographic and Geodemographic Analysis, 2000; National Student Clearinghouse, 1997 to 2001 FER105H04.xls
Enrollment Competitive Set … Primary Competitors • Additionally, fifteen schools emerge as secondary enrollment competitors. Ferrum College’s Secondary Enrollment Competitors Source: The College Board, 1995; Geographic and Geodemographic Analysis, 2000; National Student Clearinghouse, 1997 to 2001 FER105H04.xls
Enrollment Competitive Set … Primary Competitors • However, based on discussions with the core Ferrum team, two have been moved to the primary enrollment competitive list. Ferrum College’s Secondary Enrollment Competitors Source: The College Board, 1995; Geographic and Geodemographic Analysis, 2000; National Student Clearinghouse, 1997 to 2001 FER105H04.xls
Enrollment Competitive Set … Tertiary Competitors • Three schools, plus various out of state community colleges, emerge as tertiary enrollment competitors. Ferrum College’s Tertiary Enrollment Competitors Source: The College Board, 1995; Geographic and Geodemographic Analysis, 2000; National Student Clearinghouse, 1997 to 2001 FER105H04.xls
Enrollment Competitive Set … Comparisons • Let us now concentrate on comparisons between Ferrum College and the primary enrollment competitive set. • Type of institution • Cost • Enrollment • Student body • Academic rating • Program offerings • Comparable data on Virginia community colleges is not available and, therefore, will not be included in these comparisons.
Enrollment Competitive Set … Comparisons … Type • Ferrum College competes with both private and public, regional and national, colleges and universities. Ferrum College and Primary Enrollment Competitors – Type of Institution, 2001 Source: America’s Best Colleges, U.S. News & World Report, 2001 FER105H07.xls
Enrollment Competitive Set … Comparisons … Type • Except for Bridgewater and Roanoke colleges, all of the primary enrollment competitors offer both undergraduate and graduate degrees. Ferrum College and Primary Enrollment Competitors – Degrees Offered, 2001 Source: America’s Best Colleges, U.S. News & World Report, 2001 FER105H09.xls
Enrollment Competitive Set … Comparisons … Cost • Among primary competitors, tuition at Lynchburg, Roanoke, Bridgewater, Averett, Elon, and Emory and Henry is higher than at Ferrum College. Ferrum College and Primary Enrollment Competitors – Average Tuition, 2001* Note*: Includes tuition and expenses for in-state students only. Source: America’s Best Colleges, U.S. News & World Report, 2001
Compound Annual Growth Rate 1995 to 2001: 4.5% Enrollment Competitive Set … Comparisons … Cost • Ferrum College tuition has grown, on average, 4.5% a year since 1995. Ferrum College Average Tuition, 1995 to 2001 Source: National Center for Education Statistics, 2000; Ferrum College, 2001
Enrollment Competitive Set … Comparisons … Cost • This is in line with several other primary competitive enrollment schools, although tuition at five competitor schools actually decreased since 1995. Ferrum College and Primary Enrollment Competitors – Average Tuition Growth Rate, 1995 to 2001* Note*: Includes tuition for in-state students only. Source: America’s Best Colleges, U.S. News & World Report, 1995 to 2001 FER105H21.xls
Average Grant Received: $7,099 $12,049 $5,802 $3,330 $10,016 $12,608 $3,209 Enrollment Competitive Set … Comparisons … Cost • About three-fourths of all freshman at Bridgewater, Emory and Henry, and Averett receive needs-based grants, similar to Ferrum; fewer students at the other primary competitors receive similar aid. Ferrum College and Primary Enrollment Competitors – Percent of Freshman Receiving Needs-Based Grants, 2001 Source: America’s Best Colleges, U.S. News & World Report, 2001
Average Grant Received: $2,614 $3,230 $2,404 $2,889 $4,606 $3,385 $7,702 Enrollment Competitive Set … Comparisons … Cost Ferrum College and Primary Enrollment Competitors – Percent of Freshman Receiving Needs-Based Grants, 2001 (continued) Source: America’s Best Colleges, U.S. News & World Report, 2001
Enrollment Competitive Set … Comparisons … Enrollment • University of Virginia is the most selective college, based on acceptance rates, across the primary enrollment competitive schools Ferrum College and Primary Enrollment Competitors – Acceptance Rates, 2001 Source: America’s Best Colleges, U.S. News & World Report, 2001 FER105H08.xls
Enrollment Competitive Set … Comparisons … Enrollment • Ferrum College appears to be smaller than its primary competitors, in terms of number of students. Ferrum College and Primary Enrollment Competitors – Number of Full-time Undergraduates, 2001 Source: America’s Best Colleges, U.S. News & World Report, 2001
Percent Difference 1995 to 2001: -17% Enrollment Competitive Set … Comparisons … Enrollment • Ferrum College full-time undergraduate enrollment has decreased 17% from 1995 to 2001. Ferrum College Full-time Undergraduate Enrollment, 1995 to 2001 Source: Ferrum College, 2001
Enrollment Competitive Set … Comparisons … Enrollment • Nearly all the primary enrollment competitors saw their enrollments increase during the same time period. Ferrum College and Primary Enrollment Competitors – Full-time Undergraduate Enrollment, 1995 to 2001* Source: America’s Best Colleges, U.S. News & World Report, 1995 to 2001 FER105H22.xls
Enrollment Competitive Set … Comparisons … Enrollment • Ferrum College has a lower average freshman retention rate compared to the primary competitive schools, with the exception of Averett, which has a comparable rate. Ferrum College and Primary Enrollment Competitors – Average Freshman Retention Rates, 2001 Source: America’s Best Colleges, U.S. News & World Report, 2001
Percent Point Difference 1995 to 2001: -1 Enrollment Competitive Set … Comparisons … Enrollment • Ferrum College freshman retention has remained flat since 1995. Ferrum College Freshman Retention Rate, 1995 to 2001 Source: National Center for Education Statistics, 2000; Ferrum College, 2001
Enrollment Competitive Set … Comparisons … Enrollment • Five competitive schools have seen their retention rates decrease since 1995, although eight competitors have experienced an increase or seen their rates remain constant. Ferrum College and Primary Enrollment Competitors – Freshman Retention Rate, 1995 to 2001 Source: America’s Best Colleges, U.S. News & World Report, 1995 to 2001 FER105H24.xls
Enrollment Competitive Set … Comparisons … Student Body • On average, Ferrum College freshman have lower SAT scores than freshman at primary enrollment competitive schools. Ferrum College and Primary Enrollment Competitors – Average SAT Scores, 2001 NA Source: The Princeton Review, 2001
Enrollment Competitive Set … Comparisons … Student Body • Primary competitive schools, with the exception of Virginia Tech, appear to attract a higher percentage of female students than Ferrum College. Ferrum College and Primary Enrollment Competitors – Gender Distribution of Undergraduates, 2001 Female Male Source: America’s Best Colleges, U.S. News & World Report, 2001
Enrollment Competitive Set … Comparisons … Student Body Ferrum College and Primary Enrollment Competitors – Gender Distribution of Undergraduates, 2001 (continued) Female Male Source: America’s Best Colleges, U.S. News & World Report, 2001
Enrollment Competitive Set … Comparisons … Student Body • Ferrum College is more racially diverse than most of the primary competitive schools. Ferrum College and Primary Enrollment Competitors – Racial/Ethnic Distribution of Undergraduates, 2001 Hispanic/Asian/Other African-American White Source: America’s Best Colleges, U.S. News & World Report, 2001
Enrollment Competitive Set … Comparisons … Student Body Ferrum College and Primary Enrollment Competitors – Racial/Ethnic Distribution of Undergraduates, 2001 (continued) Hispanic/Asian/Other African-American White Source: America’s Best Colleges, U.S. News & World Report, 2001
Enrollment Competitive Set … Comparisons … Student Body • With the exception of Christopher Newport, Ferrum College has a lower average graduation rate compared to the primary competitive schools. Ferrum College and Primary Enrollment Competitors – Average Graduation Rates, 2001 Source: America’s Best Colleges, U.S. News & World Report, 2001
Percent Point Difference 1995 to 2001: 5 Enrollment Competitive Set … Comparisons … Student Body • Ferrum College graduation rates have increased slightly since 1995. Ferrum College Graduation Rate, 1995 to 2001 Source: National Center for Education Statistics, 2000; Ferrum College, 2001
Enrollment Competitive Set … Comparisons … Student Body • While several competitive schools have seen their graduation rates decrease since 1995, the majority of competitors have also experienced at least a slight increase. Ferrum College and Primary Enrollment Competitors – Graduation Rate, 1995 to 2001 Source: America’s Best Colleges, U.S. News & World Report, 1995 to 2001 FER105H23.xls