Download
1 / 16
160 likes | 208 Views
This topic delves into the inference of the Yeast cell-cycle regulation network focusing on genetic interactions. Methods such as Epistatic Miniarray Profile (EMAP) and Microarray Gene Expression EMAP are explored. Challenges like clustering noisy data and selecting appropriate methods are addressed. Cell-cycle related genes separation into 4 periods (S, G1, M, G2) using microarray data and modeling strategies are discussed. Techniques like Time-lagged Correlation Analysis for gene activation and clustering for functional organization are examined. The combination of EMAP and Microarray data for enhanced analysis is emphasized, providing insight into the complex cellular processes.

E N D
Experience Methods • EMAP(Epistatic Miniarray Profile) Double mutant • Microarray Gene expression
EMAP • Null hypothesis: where , , and represent the fitnesses (or growth rates) relative to wild-type organisms with mutation A, with mutation B, and with both mutations, respectively. - +
S score • The definition of S score
Cluster Functional Organization of the S. cerevisiae Phosphorylation Network Dorothea Fiedler Cell 2009
Cluster • Problem1: Cluster using the whole data set always did not show good results because of the noise and the complex network. • Problem2: How to select a cluster method. • Single, Complete, SVM(MCL, Diffusion Kernel)
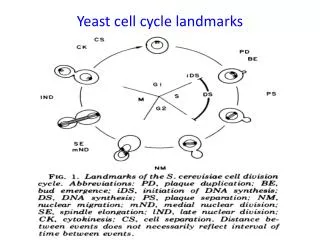
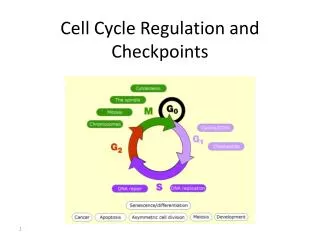
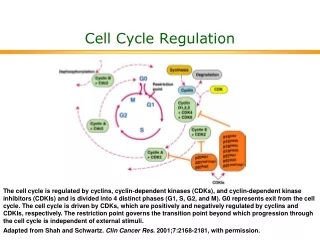
Problem1: Additional Information • Cell-Cycle Related Genes could be separated to 4 periods - S, G1, M, G2
Microarray data • Time cause microarray experiments
RPM Model • From: “A random-periods model for expression of cell-cycle genes” Delong Liu et al. PNAS 2004 • Model:A nonlinear regression model for quantitatively analyzing periodic gene expression
How to find cell cycle related genes? • Use estimates from fitting the RPM to known cell-cycle genes to inform a correlation approach for selecting other cell-cycle-related genes.
Another way to use microarray data • High positive S-score with microarray evidence • Time-lagged Correlation Analysis • The activation of a gene by a TF in a nonlinear (sigmodial) fashion • where is relative expression at the time point for a given TF, is the mean of the TF expression profile over all time points and s is the standard deviation
Time-lagged Correlation Analysis • The definition of time-lagged: • T : denote the estimated cell cycle period of a particular experiment. • : denote the estimated phase angle of gene g • :
Time-lagged Correlation Analysis • The Correlation Analysis: • Calculate the spearman rank correlationof and where
Combined EMAP and Microarray • Microarray cluster + S-score cluster • Significant S-score + Time-Lagged Correlation
Reference • Sean R Collins, A strategy for extracting and analyzing large-scale quantitative epistatic interaction data, Genome Biology 2006 • Dorothea Fiedler, Functional Organization of the S. cerevisiae Phosphorylation Network, Cell 2009 • Delong Liu, A random-periods model for expression of cell-cycle genes, PNAS 2004 • Pierre R. Bushel, Dissecting the fission yeast regulatory network reveals phase-specific control , Systems Biology 2009