Comprehensive Plan for NPS Reporting Procedures
Learn about the goals and benefits of the new Comprehensive Plan for Recreation Fees at NPS, streamline processes, compare old vs. new practices, understand database functions, and more.

Comprehensive Plan for NPS Reporting Procedures
E N D
Presentation Transcript
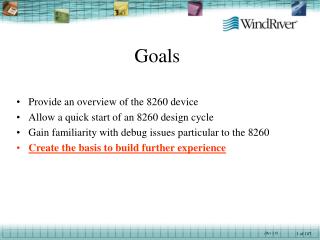
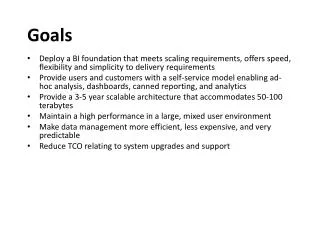
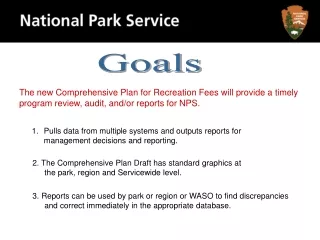
Goals The new Comprehensive Plan for Recreation Fees will provide a timely program review, audit, and/or reports for NPS. • Pulls data from multiple systems and outputs reports for management decisions and reporting. 2. The Comprehensive Plan Draft has standard graphics at the park, region and Servicewide level. 3. Reports can be used by park or region or WASO to find discrepancies and correct immediately in the appropriate database.
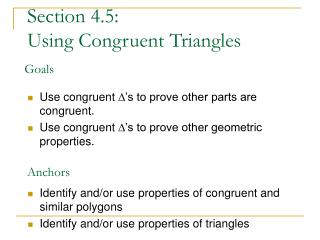
Objectives Of This Broadcast During/After this broadcast, the student will: • Understand the goals of the new Comprehensive Plan for streamlining Recreation Fee processes, timely program review/audit and NPS reporting. • Compare the new practices to be established based on the National Park Service Comprehensive Plan to the previous practices. • Identify functions of the Comprehensive Plan database and its' relationship to other software systems: Project management Information System (PMIS), the Facility Management Software System (FMSS) and Federal Financial System.
Objectives Of This Broadcast …Continued During/After this broadcast, the student will: • Identify correct use of data fields in these systems including how to create a Parent Work Order and understand how these business practices are crucial to the new Comprehensive Plan. • Describe the Management Reports your park or region can produce to assist in decision making and to track progress towards goals. • Describe the Comprehensive Plan template which will produce a region and Servicewide management report that provides all the information and graphics about an individual park including their 5-year plan for revenue expenditures from FY 2007 – FY 2011.
Roles & Responsibilities Policy development Reporting out Certifying Comp Plans Auditing WASO Approving Projects Policy enforcement Data Cleanup Review Formulate Send projects to DC REGIONS PARKS Collect revenues Identify, Prioritize and Execute Projects
April 14 to End of May 2006. WASO will be certifying the Comprehensive Plans and moving them forward for informational purposes to DOI and Congress. March 2006 – Comprehensive plan template available that will pull in formulated projects & parks begin to plan their expenditures for 2007-2011. Oct 18, 2005. Servicewide Comprehensive Call starts TIMELINE Future Regions and WAS0 use the Comp Plans to audit the fee program, Report and Provide timely information to outside stakeholders, Verify and Validate the data in the software systems. July 2005. Parks enter projects into PMIS for 5 years of revenue-2007-2011. End of Feb. 2006. Regions have projects approved, reviewed, and formulation work done. April 14, 2006. Regions will complete review and approval of Comp Plan. Parks identifying assets deficiencies in FMSS & Project needs in PMIS (ongoing)
Comparison of Old Comprehensive Plan to New Comprehensive Plan Old Comprehensive Plan New Comprehensive Plan • Data pulled automatically from FFS, PMIS, FMSS • Parks will only have to enter projected obligations for future years • Once a change is made in a program such as PMIS it shows up on the plan • Provides management reports in an 8½x11 format that can be printed and used as planning and management tools • Required manual input • Changes had to occur in multiple places i.e.: PMIS, FMSS and then Comp Plan had to be updated to match • More difficult to work with – large spreadsheets to print and manipulate
Comparison of Old Comprehensive Plan to New Comprehensive Plan Old Comprehensive Plan New Comprehensive Plan • Was not directly tied into the approval process for projects • Did not include FCI/API • Did not tie in visitation information • Will be used as the approval process for Recreation Fee Projects • Includes FCI/API • Contains visitation information
Comparison of Old Comprehensive Plan to New Comprehensive Plan Old Comprehensive Plan New Comprehensive Plan Information Available Reports & Tools Available • Revenue • Allocations • Obligations (past and projected) • Deferred Maintenance Pie Chart • Breakdown of Categories Pie Chart • Un-obligated Balances • Project Status Information • Revenue Breakdown • Allocations vs. Obligations by Year • Current Year Planned vs. Current Year Actual Obligations by Component • Deferred Maintenance By Year • Obligations by FLREA Category and by Fee Demo Category • Un-obligated Balance & Planned Obligations Over 1-5 Year(s) • Funding Component Status Reports With Last Date of Update
Comparison of Old Comprehensive Plan to New Comprehensive Plan Old Comprehensive Plan New Comprehensive Plan Information Available Reports & Tools Available • DOI Criteria • Cost of Collections • Components Completed by Year by Fund Source • Future Funding Components & Funding (5-year plan) • Formulated and approved Projects by Year. • Formulated Component Report by Category & Year • 15% Administration • Carryover Balance and Recoveries • Balance by Fund Source and Total Balances • Scatter Plot of FCI/API Assets • Visitation & Collection • DOI Criteria Pie Chart • Cost of Collection Information • Components Completed • Future Funding Components • Pending and Approved Projects
FMSS PMIS PMIS Project Parent Work Order “A” (PWO) Component “A” PWO “B” Component “B” Child Work Order (CWO) CWO CWO CWO FMSS and PMIS Hierarchy Relationship
FMSS Relationship PMIS Notes Short Description Field EQUALS PMIS Project Component Title Field Add “PMIS:” to the beginning of the FMSS Description Field Current Cost Estimate at Approval EQUALS Funding Component Request Amount Field Under Park Planning Section: PMIS # is the numeric field Component is an alpha field. EQUALS PMIS Component Number (Auto-populated) EQUALS Parent Workorder Number (Auto-populated) Put the PWO number in the “Related FMSS WO NumbersField” Only the PWO number should be entered into PMIS. PWO Long Description Field EQUALS Data Field Relationships for Parent Work Orders (FMSS) and Components (PMIS) Portion of the Project Description Field + Component Description Field
FMSS Relationship PMIS Notes Deferred Maintenance Percentage and Capital Improvement Percentages May OR May Not EQUAL Deferred Maintenance Percentage and Capital Improvement Percentages PMIS DM and CI are based on DOI criteria which differs from the criteria FMSS defines DM and CI Cost Source Field CESS Estimate Other Documented estimates Somewhat EQUALS Estimate Generated by CESS Field “Component Cost Estimate” line for labor, materials, supplies and equipment PMIS is a yes/no pick; FMSS is a drop with other options – these fields should correspond General Ledger Account Numbers EQUALS Funded PWE Accounts All must EQUAL AFS3 and FFS EQUALS More Data Field Relationships for Data Roll Up It is extremely important that each PMIS component is linked to the proper FMSS Parent/Child Hierarchy.
FMSS Relationship PMIS Notes Data Field Relationships for Comp Plan Data Roll Up
THE BIG PICTURE: WHY, WHY, WHY!!! All this Data Management? • 3 BIG Questions: • What resources are needed for the NPS to manage our assets considering the total cost of ownership – deficiencies, preventative maintenance, component renewal, etc.? • How is the NPS expending the funds that it already receives and what role do Fee Revenues play to reach the NPS performance goals? • What are the measurable results of these expenditures?
New PMIS Project Component New FMSS Hierarchy PMIS Project Submitted in SCC Reviewed and Prioritized PWO “A” Estimates Made Status: WAPPR Component “A” Submitted in SCC for Approval Component “B” Represents an Out Year is not submitted with SCC CWO Estimates Made Status: Costed Beginning FCI CWO Estimates Made Status: Costed Beginning FCI The above hierarchy is Costed and a Beginning and Projected FCIs have been calculated through a standard report. Work for the PMIS component has been bundled and planned. The above PMIS Project Component has been submitted in the SCC for review and can be reported as planned work by the region and national level. THE BIG PICTURE
Approved and Funded PMIS Project Component Live FMSS Hierarchy PMIS Project Project is Approved and Funded PWO “A” Actuals and FCI changes are rolling up from CLOSED CWOs Component “A” Component is Approved and Funded Component “B” Component Not Submitted CWO Work Is Actively Being Charged CWO Work is Complete CWO is CLOSED Above the PMIS Component “A” is Approved and Funded allowing work in the Parent/Child Hierarchy to begin. As work progresses, Component Status Reports should be completed and AFS3 and FFS will show the obligation/expenditures to date. Component Status Reports should be filled out on a regular basis or when notable work has been completed. In the above hierarchy, work is being accomplished on the CWOs. Once work is completed the CWO is closed, allowing the information to be reported for the PWO. THE BIG PICTURE
Completed PMIS Project Component CLOSED FMSS Hierarchy PMIS Project Project is Approved and Funded PWO “A” Actuals and Ending FCIs have Rolled Up PWO is CLOSED Component “A” Component is Complete Component “B” Component Not Submitted CWO Work is Complete CWO is CLOSED Ending FCI CWO Work is Complete CWO is CLOSED Ending FCI Above PMIS Component “A” has been completed. The Component Completion Report should be filled out and AFS3 and FFS will have been updated to reflect the obligation and expenditure. In the above hierarchy, the work associated with CWOs is completed and the CWOs have been CLOSED. The change in FCI as a result of work completed by the PMIS project can be reported. THE BIG PICTURE
To ensure that the data is correctly imported in the Comprehensive Plans and no errors reports are generated the following actions are needed. • DATA IN PMIS: • Enter Account #’s in PMIS as they appear in FFS • “ ORG-PROJ-PWE.” • If the PWE or the PROJ # was for the same PMIS component, add the second account # to PMIS. This is a problem with old data and should not be occurring now. • Ensure that there is a IWPN # in FFS. Account #’s and IWPN #’s are the links between the FFS and PMIS data. • Correct all Titles for Multiyear Projects example: FY 2007-FY 2011 Cost of Collection –Operations.
To ensure that the data is correctly imported in the Comprehensive Plans and no errors reports are generated the following actions are needed. …continued • DATA IN PMIS: • DOI criteria filled correctly for the Facility projects as they determine whether a project is DM or not. • The PMIS “Activities, Assets and Emphasis Areas” are correct to enable reporting to Fee Demo and REA categories and future queries. • Completion Report and the Status Report updated and correct completion amount entered for the component. • A Correct FMSS # in PMIS is the Reference Key between PMIS and FMSS. • Change requests should be reflected in the funded amount in PMIS.
To ensure that the data is correctly imported in the Comprehensive Plans and no errors reports are generated the following actions are needed. • DATA IN FFS: • Correct Account #’s ORG-PROJ-PWE, Some account numbers are missing PROJ #’s and or have PROJ # as only 1 or 2 digits. Narrowband Radios should have NBRA as PROJ #. • IWPN #’s correctly entered in FFS as ALPHACODE followed by PMIS#. • PMIS# used at the beginning of the FFS description of a project component. • Correct PWE use for the deposit of revenues. • Correct PWE for the Project expenditures for all the projects.
Activity 1 You have 15 minutes to complete activity 1 found in your Participant Guide.
Management Reports Management and Reporting Tools • Revenues and Unobligated Balance • Obligations • Cost of Collections % • Deferred Maintenance VS. Non Deferred Maintenance • Deferred Maintenance by DOI Criteria • Deferred Maintenance by FCI Change • Component Status & Completion • API/ FCI Asset Analysis • Transportation System Projects • Status Audit Report • Project Execution Needs
Management Reports Management and Reporting Tools • Revenues and Unobligated Balance • This report can be run for all Years for : • Allocations • Allocations by Fund Source • Revenue • Obligations • Visitation • Planned Obligations • Total Unobligated Balance • Unobligated Balance by Fund Source • Carryover Balance and Recoveries The Reports can be obtained for any of the following: - Park - State - Region - Servicewide
The output of the reports will have both a table and a graph for example: Management Reports Management and Reporting Tools
Management Reports Management and Reporting Tools The output of the reports will have both a table and a graph for example:
Management Reports Management and Reporting Tools • 2. Obligations • This report can be run for all Years for: • Actual Obligations • Obligations by Fee Categories • Obligations by REA Categories including15% • Planned Obligations The Reports can be obtained for any of the following: - Park - State - Region - Servicewide
Management Reports Management and Reporting Tools The output of the reports will have both a table and a graph Example Table: National Park Service Fee Demo Total Obligations by Year ($ thousands)
Management Reports Management and Reporting Tools Example Graph: “A” Park’s 2004 Obligations by Fee Demo Categories
Management Reports Management and Reporting Tools • 3. Cost of Collections • This report can be run for all Years for: • COC obligations • COC requested Amount • Revenues by PWE • COC-Capital Requested Amount • COC-Capital Obligations The Reports can be obtained for any of the following: - Park - State - Region - Servicewide
Management Reports Management and Reporting Tools The output of the reports will have both a table and/or a graph Example:
Management Reports Management and Reporting Tools • 4. Deferred Maintenance vs. Non Deferred Maintenance Expenditures: • This report can be run for all Years for: • Deferred Maintenance Approved Components • Deferred Maintenance Obligations • Non Deferred Maintenance Approved Components • Non Deferred Maintenance Obligations • By REA Categories • By Fee Demo Categories The Reports can be obtained for any of the following: - Park - State - Region - Servicewide
Management Reports Management and Reporting Tools The output of the reports will have both a table and/or a graph Example:
Management Reports Management and Reporting Tools • 5. Deferred Maintenance by DOI Criteria • This report can be run for all Years for: • Seven DOI Categories • Obligations planned • Actual Obligations The Reports can be obtained for any of the following: - Park - State - Region - Servicewide
Management Reports Management and Reporting Tools The output of the reports will have both a table and/or a graph Example:
Management Reports Management and Reporting Tools • 6. Deferred Maintenance by FCI Change • This report can be run for all Years for: • FCI Before • FCI After • FCI Change • Asset # • Primary Asset Type • By Project Component Planned • By Project Component Completed • By Obligations The Reports can be obtained for any of the following: - Park - State - Region - Servicewide
Management Reports Management and Reporting Tools The output will be report tables and/or a graph. Example:
Management Reports Management and Reporting Tools • 7. Component Status and Completion • This report can be run for all Years for: • Component Status • Component Completion Date • Component Status Last Update Date • Planned Start Date • Planned Completion Date • Planned Projects The Reports can be obtained for any of the following: - Park - State - Region - Servicewide *This Report will be a list of Projects
Management Reports Management and Reporting Tools • 8. API/ FCI Asset Analysis • Scatter Plot that identifies Asset importance (API) and condition (FCI) • List of deficiencies by asset • List of identified work-types by asset • List of current PMIS projects identified by work-order The Reports can be obtained for any of the following: - Park - State - Region - Servicewide
This Reports output will be a Scatter Plot with a list of projects Example:
Management Reports Management and Reporting Tools • 9. Transportation System Projects • This report can be run for all Years for: • Proforma Predicted • Operations Cost • Transportation Revenue • Maintenance of System Components • Replacement Schedule The Reports can be obtained for any of the following: - Park - State - Region - Servicewide
Management Reports Management and Reporting Tools 10. Status of Fee Program/Audit Reports This group of reports will help to verify and validate that data from PMIS, FMSS and FFS is correct and imported correctly into the Comprehensive Plan The Reports can be obtained for any of the following: - Park - State - Region - Servicewide
Activity 2 You have 15 minutes to complete Activity 2 found in your Participant Guide.
Comprehensive Plan Template • Open up Template (included as participant materials) • The charts at the top are the standard questions that NPS reports on • Some of these are performance measures • At this point the park can open the template, pull in their projects that are formulated • Highlighted gray area they input what they are going to spend in what years – as they do that the charts above will update so they can see if the plan is meeting Servicewide goals • Park Superintendent will certify and lock it down as their 2007-2011 plan and the region will review these and approve them. • WASO Certifies the Comp Plan and using them to report what NPS is doing with fee funds. • An important value is regions and WASO can report on performance targets without data collection“firedrills”.
20% Comprehensive Plan Template • Open up Template (included as participant materials) • The charts at the top are the standard questions and performance measures that NPS reports on • At this point the Region or Associate can open the template, pull in their projects that are formulated • Highlighted gray area they input what projects they would like funded in what years – as they do that the charts above will update so they can see if the plan is meeting Servicewide goals • The Regional Director or Associate will certify and lock it down as their 2007-2011 plan. • WASO Approves the 20% projects and Approves the Servicewide 20% Comp Plan for 2007-2011 • NPS will report using the Comp Plan what it is doing with Agencywide funds.
Further questions? Need more help? Contact your Regional Point of Contact Website for further information: InsideNPS_ WASO_ Park Planning, Facilities, and Lands_ Park Facility Management Division_ Recreation Fee Projects Management Thank You for joining us TODAY!