Download

1 / 30
300 likes | 394 Views
Solve the staff rostering problem in a childcare center using mathematical optimization techniques to minimize employment costs. Learn about decision variables, constraints, objectives, software tools, and other industry applications. Realize operational efficiency and savings through efficient staff allocation.

E N D
Optimisation = Efficiency + Savings • Kellogg’s • The largest cereal producer in the world. • LP-based operational planning (production, inventory, distribution) system saved $4.5 million in 1995. • Procter and Gamble • A large worldwide consumer goods company. • Utilised integer programming and network optimization worked in concert with Geographical Information System (GIS) to re-engineering product sourcing and distribution system for North America. • Saved over $200 million in cost per year. • Hewlett-Packard • Robust supply chain design based on advanced inventory optimization techniques. • Realized savings of over $130 million in 2004 Source: Interfaces
Real Practical Problem x2 Mathematical (Optimization) Problem Mathematical Solution Method (Algorithm) Computer Algorithm Decision Support Software System Human Decision-Maker Mathematics in Operation
Information Systems Decision Support Interface Decision Support Tool
A Team Effort Users Interface Decision Support Tool Ops Res Comp Sci Information Systems Biz Analyst Info Sys
Staff Rostering Allocating Staff to Work Shifts A significant role for the “Team”
The Staff Rostering Problem • What is the optimal staff allocation? • Consider a Childcare Centre: • The childcare centre is operating 5 days/week. • There are 10 staff members. • Each staff member is paid at an agreed daily rate, according to the skills they possess. • One shift per day • Skills can be categorised into 5 types. • (Singing,Dancing) • (Arts) • (Sports) • (Reading,Writing) • (Moral Studies,Hygiene)
…other information • CONSTRAINTS: • Skill Demand • The daily skill demand is met. • Equitability (breaks,salaries) • Each staff member must at least work 2 days/week and can at most work 4 days/week. • Workplace Regulation • On any day, there must be at least 4 staff members working. • OBJECTIVE: • Minimise Total Employment Cost/Week
Problem Solving Stages Staff Rostering at Childcare Centre Real Practical Problem Mathematical Programming Mathematical (Optimization) Problem Mathematical Solution Method (Algorithm) CPLEX XpressMP LINGO Computer Algorithm Decision Support Software System Excel with VBA Childcare Centre Manager Human Decision-Maker
The Mathematical Problem • Modelled as an Integer LP • Decision variables are integers, i.e. variables can only take 0,1,2,… not 0.2, 1.1, 2.4 etc. • A binary variable: a decision variable that can only take 0 or 1 as a solution.
Integer LP (just for show…) Skill Demand Equitability Workplace Regulation
XpressMP • Large-scale optimisation software developed by Dash (http://www.dashoptimization.com) • Xpress-IVE (Interactive Visual Environment)
Decision Support Software System • Excel Interface • Database Management: • Staff Profile (Name, Category) • Annual leave • Shift preferences • Reserve staff • Roster • etc…. • Information system installed to disseminate information (shift preference, roster etc.) effectively throughout the organisation
Other Issues and Challenges • Breaks • scheduled breaks • annual leave • festive breaks (under-staffing issues) • Fatigue • limit to number of working hours per day/week/fortnight (Union Requirements) • Equitable roster • equitable weekend/night shifts • Motivation • skill utilisation (avoid monotonous job routine) • Training • training and development (scheduled)
Other Industry Requiring Staff Rostering • Airline (air crew and ground staff) • Health (nurses and doctors) • Manufacturing (operators) • Transport (truck drivers) • Entertainment and gaming • Education (teachers, lecturers) MORe is currently involved in several (long-term) staff rostering projects for Australia-based companies in at least one of the industries mentioned above.
Force Optimisation A collaborative project between Melbourne Operations Research (MORe) & Defence Science and Technology Organisation (DSTO), Department of Defence, Australian Government
Project Background • DSTO LOD working with Melbourne Operations Research (MORe), The University of Melbourne • Project aim: support the Army (Force Design Group) with their capability options development and analysis, seeking • What types of forces should be maintained? • What force strength is required? to ensure forces are effective in achieving defence objectives • Project started in mid-2004 and successfully completed its modelling, interface design and testing phases in the beginning of year 2005 • The model will be presented at the Australian Society for Operations Research 2005 Conference (26-28th September)
General Aim of Project Forces “wishlist” Choose forces (STRATEGIC) budget $ $ $ $ Force configuration Deploy forces (TACTICAL) e e e e e e e max effectiveness Objectives
The Mathematical Model • An integer LP-based prototype decision support tool has been developed. • The support tool, ForceOp, has an Excel interface, written with VBA and optimised using XpressMP. • Future directions • database management • integrated military systems – Military Information System
The ForceOp Tool • Before this tool, • force design was carried out manually • a lengthy and laborious process, based on intuitive-reasoning (no quantitative basis). • difficult to assess effectiveness or compare quality of solutions • With this tool, • solutions can be obtained fast. • quality of solutions can be quantified. • many sets of objectives can be tested within a short period of time. • many different force configurations can be tested against a given set of objectives.
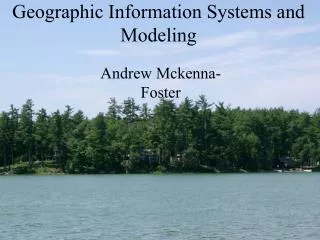
Facility Location Decisions LP as a “What-If” Tool
The Facility Location Problem • LP-based techniques can be used to locate • manufacturing facilities, • distribution centres, • warehouse/storage facilities etc. taking into consideration factors such as • facility/distribution capacities, • customer demand, • budget constraints, • quality of service to customers etc. using Operations Research techniques such as • linear programming, • integer linear programming, and • stochastic programming. • With OR techniques, solutions for the facility location problem can be obtained fast, and hence, we are able to perform a large range of “what-if” scenarios.
Problem Statement 36km Customer 10 000 W-3 36km 180 000 Warehouse (W) W-4 D C • Assume: • Transportation cost: $20/km/unit • Warehouses have the same O/H cost • Warehouse has very large capacity • Problem modelled as an integer linear program, and solved using XpressMP. 220 000 180 000 B E W-5 W-2 10 000 units A F W-1 W-6 10 000
Scenario 1 • Scenario 1: Warehouse O/H cost is very small as compared to transportation cost • Warehouse O/H: $6 000 000 • Transportation cost: $20/km/unit • proximity dominates • operate the warehouse closest to each customer 10 000 W-3 180 000 W-4 D C 220 000 180 000 B E W-5 W-2 10 000 units A F W-1 W-6 10 000
Scenario 2 • Scenario 2: Warehouse O/H cost is very large as compared to transportation cost • Warehouse O/H: $1 800 000 000 • Transportation cost: $20/km/unit • too expensive to operate a warehouse • hence, the most centralised warehouse selected (based on demand & distance) 10 000 W-3 180 000 W-4 D C 220 000 180 000 B E W-5 W-2 10 000 units A F W-1 W-6 10 000
Scenario 3 • Scenario 3: Both warehouse O/H and transportation costs are competing • Warehouse O/H: $60 000 000 • Transportation cost: $20/km/unit • solution is not obvious; too many possibilities 10 000 W-3 180 000 W-4 D C 220 000 180 000 B E W-5 W-2 10 000 units A F W-1 W-6 10 000
Scenario 4 • Scenario 4: Both warehouse O/H and transportation costs are competing AND warehouse capacity limited • Warehouse O/H: $60 000 000 • Transportation cost: $20/km/unit • Warehouse capacity: 150 000 units 10 000 W-3 180 000 W-4 D C 150 000 220 000 180 000 10 000 30 000 B 110 000 E W-5 150 000 W-2 10 000 units 70 000 70 000 A F 10 000 10 000 W-1 W-6 10 000
Facility Location • Possible variants • closure decisions • acquisition decisions • Possible extensions • limitations to the number of distribution centres • warehouse-customer distance constraint • complex cost functions • uncertain demand
Other OR Applications • Other areas where OR techniques have been proven to be useful include • Inventory control • Warehouse design, storage and retrieval, order picking • Vehicle routing • Delivery transport mode selection • Capacity and manpower planning • Production scheduling …and other resource usage and allocation decisions.