Download
1 / 13
130 likes | 277 Views
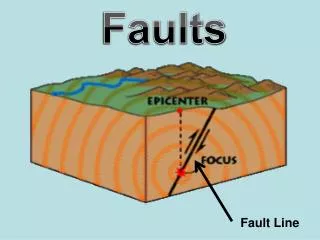
Introduction to faults. Looking at a fault on seismic data. 1 km. This seismic profile has one interpreted horizon marked as a yellow dashed line and a fault marked on with a black line. Fault. Interpreted horizon. Interpreted horizon. 1 km.

E N D
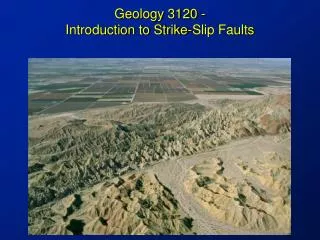
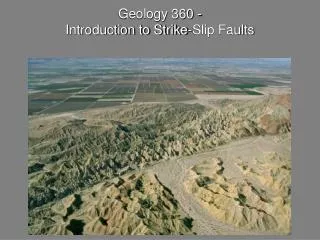
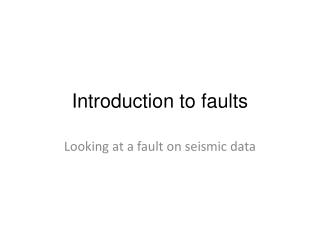
Introduction to faults Looking at a fault on seismic data
1 km This seismic profile has one interpreted horizon marked as a yellow dashed line and a fault marked on with a black line. Fault Interpreted horizon Interpreted horizon
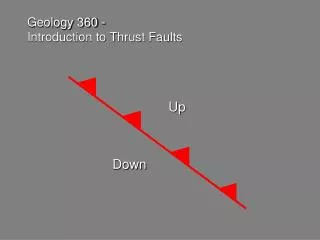
1 km A fault is defined by describing the direction and amount of movement.
1 km The only type of movement that can be seen on a seismic profile is a vertical displacement and so this is a dip-slip fault. The movement can be marked on with arrows and is called the throw. Downthrow Upthrow ↼ ↼ The south side of this fault is called the downthrow side. The north side is called the upthrow side.
1 km Why is there no strike-slip movement seen? Downthrow Upthrow ↼ ↼ Because the seismic is a 2 dimensional image of the sub-surface looking only from the side.
1 km The upthrow and downthrow are used as descriptors of the fault, they do not indicate the actual nature of the movement. For example the south side may have stayed still and the tectonic forces moved only the north side up, there are several other possibilities: Downthrow Upthrow ↼ ↼ Only the south side moved down, the north stayed still. OR Both sides have moved a bit, the movement on either side may not have been equal. OR EVEN Both sides have moved many times, both up and down in successive periods of tectonic activity. Each time this happens the fault is re-activated.
1 km The amount of displacement can be measured. In the field this would be in metres but here the seismic data is in TWT and so must be measured in msec. Upthrow Downthrow ↼ ↼ The next slide shows how the throw is measured on an enlarged view.
The throw is measured as a vertical distance. It is taken as the place where the horizon and the fault intersect. The throw is 100msec. 100msec Enlarged view of the fault
1 km Upthrow Notice the scale bar at the top of the data. This is a far larger area than you would normally see in the field. How many metres do you think 100msec represents on this data? Downthrow ↼ ↼ On this seismic profile the seismic velocity at TWT 1000msec is 4200m/s. Calculate the throw in metres using this seismic velocity and the distance, speed, time formula triangle. 100msec
Converting the throw to metres The seismic velocity is 4200m/s. The throw is 100msec TWT. 1. The units need to match. Convert 100msec TWT to one way time. 100 ÷ 2 = 50msec 2. Next convert 50msec to seconds 1 second = 1000msec 1 ÷ 1000 = 0.001 therefore 1msec = 0.001s 0.001 × 50 = 0.05 and so 50msec = 0.05s 100msec 3. Use the distance, speed, time formula triangle: Put your finger over the number you want to calculate, which is distance: speed = 4200m/s time = 0.05s 4200 × 0.05 = 210m At the yellow horizon the throw of the fault is 210m to the south.
1 km This seismic profile has one interpreted horizon marked as a yellow dashed line and a fault marked on with a black line. A fault is defined by describing the direction and amount of movement. The only type of movement that can be seen on a seismic profile is a vertical displacement and so this is a dip-slip fault. The movement is called the throw and is marked on with arrows. The south side of this fault is called the downthrow side. The north side is called the upthrow side. These names are used as descriptors of the fault, they do not indicate the actual nature of the movement, for example the south side may have stayed still and the tectonic forces moved only the north side up, there are several other possibilities. The amount of displacement can be measured. In the field this would be in metres but here the seismic data is in TWT and so must be measured in msec. Using seismic velocity the throw is calculated as 210m to the south at the interpreted horizon. Downthrow Upthrow ↼ ↼ 100msec
1 km This seismic profile has one interpreted horizon marked with a dashed white line and a fault marked on with a black line. A fault is defined by describing the direction and amount of movement. The only type of movement that can be seen on a seismic profile is a vertical displacement and so this is a dip-slip fault. The movement is called the throw and is marked on with arrows. The south side of this fault is called the downthrow side. The north side is called the upthrow side. These names are used as descriptors of the fault, they do not indicate the actual nature of the movement, for example the south side may have stayed still and the tectonic forces moved only the north side up, there are several other possibilities. The amount of displacement can be measured. In the field this would be in metres but here the seismic data is in TWT and so must be measured in msec. Using seismic velocity the throw is calculated as 210m to the south at the interpreted horizon. Downthrow Upthrow ↼ ↼ 100msec