Download
1 / 32
320 likes | 434 Views
Exploring Optimal Locations for Underwater Turbine Emplacement near Marine Navigation Passageways Steps to a “go” or “no” answer. With Thanks to: MIT Sea Grant , the Chewonki Foundation , Mass Maritime Academy, Town of Hull, MA USGS, Falmouth Scientific Inc.

E N D
Exploring Optimal Locations for Underwater Turbine Emplacement near Marine Navigation Passageways Steps to a “go” or “no” answer. With Thanks to: MIT Sea Grant, the Chewonki Foundation, Mass Maritime Academy, Town of Hull, MA USGS, Falmouth Scientific Inc. Geoff Cowles, Dorothy Kelly, Peter Arnold, Stanley King, Tom Pham, Herman Gustafson, Jim Manning, Kurt Bornheim, Andy Stern, Neil Ganju, ….
The Three Sites Mass. Maritime/ Cape Cod Canal
The Three Sites The Hull Gut
The Three Sites The Sheepscot River
Site #3 The Sheepscot River
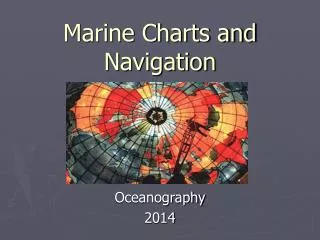
Step 1 Hydrodynamic Modeling
The Island Tidal Node
Step 2 Spatial Velocity Survey
Surveyed Areas Our sampling focused on five areas, indicated by the sampling sites (green dots) shown here. These areas were identified as high energy locations by a numerical model and by the data from a preliminary survey conducted on September 28.
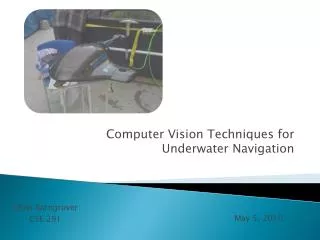
The Surveying Equipment Acoustic Doppler Current Profiler (ADCP) R/V Seagull and Capt. Stanley King
Surveyed Areas The Best Area
Under the Bridge The focus here will be on the tidal flows and tidal power near the Westport Island bridge.
Capturing the Tidal Cycle Observations out of the Nav. Channel, but with bottom depth > 7m
The Tidal Cycle The tidal velocity nicely follows a sinusoidal cycle, with maximum ebb (positive) and flood (negative) currents of slightly greater than 1 m/s. Velocities were somewhat higher directly underneath the bridge (by about 10 %), but this is a minor point.
Not the Strongest Tides of the Year But wait! The timing of our survey was based on boat and personnel availability. Unfortunately, this availability did not coincide with a time of strong tides. In fact, our survey was conducted during unusually weak neap tides, as seen by highlighting the time of our survey (in red above) on a plot of tidal height at Wiscasset.
Extending the Analysis to Other Tides With a little math, we can relate the maximum tidal velocity, Vmax, to the mean power density over the half tidal cycle. The formula is: <F> = 2ρVmax3 3π Assuming that Vmax is proportions to the height range, Hdiff, of a particular tide Vmax = Hdiff*Vmax(Sept 30) 7 ft Allows for the computation of the expected velocity and power distribution under the bridge.
Step 3 Evaluating the Bottom Conditions -Side Scan Surveying
Step 4 Installing a Moored Velocity Profiler (e.g. ADCP) Near the Best Spot
Conclusion • A four-step process: • Hydrodynamics modeling • Ship-board velocity surveying • Side-scan sonar surveying • Moored velocity profiling • Offers a cost-effective way to evaluate the tidal resource in a estuarine environment, with a “go” or “no” assessment at each step