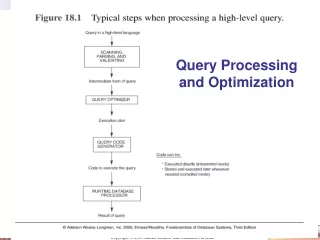
Plate Processing Optimization: Maximizing Productivity and Efficiency
Learn methods to increase plate processing productivity, optimize machine performance, and save money through systematic testing and measuring practices. Improve wash out rate performance and achieve consistent results by optimizing brushes. Discover the impact of processing time and relief depth on plate quality, and implement test designs to enhance production efficiency. Gain insights into machine operation, brush adjustment, and solvent wash techniques for cost-effective plate processing. Contact David Chinnis, the digital plates specialist at The Flint Group, for expert guidance.

Plate Processing Optimization: Maximizing Productivity and Efficiency
E N D
Presentation Transcript
Processing System Optimization David Chinnis Sr. Digital Plates Specialist The Flint Group
Three Considerations • Method • Machine • Money
Method • What methods may increase productivity? Testing and Measuring Processing Performance
Wash Out Rate Performance • Are my processor brushes optimized and consistent? • Brushes that are not level can’t possibly create consistent floors without over processing to compensate for error!
How do I know? • Check Brush Level - Incremental Processors • 12” long plate x maximum processor width • Expose header (2”), no back exposure required 1 2 3 4 5 6 7 8 9 10 11 12 • Process, dry 20 minutes • Measure 12 areas across • Shim or adjust brushes to achieve variation < .007” Batch Processors require an entire sheet to accurately measure flatness (<.015”)
Wash Out Rate Performance • Is my processing time optimized for my relief depth? • Does it make a difference?
The Method • Four plates similar size (ex. 18” x 18”) • Masking Sheet 6” smaller than plate (15” x 15”) • Face expose ONLY
The Method • Process plates at four set speeds/times • Allow a brief dry down (20 MINUTES) • Measure the results • Select plate with an average overwash of 0.008” – 0.010” measured in the unexposed area Does it make a difference? You bet it does!
Test Design • All plate material from same batch • 1 back exposure time selected to produce relief from .023” - .026” (210 seconds based on prior testing) • 3 washout rates with solvent @ 5% solids and 35°C • 250 mm/min (4.0 min) = .010” overwash • 180 mm/min (5.6 min) = .020” overwash • 120 mm/min (8.3 min) = .062” overwash (Washed to support) • All plates dried for 90 minutes @ 65°C
Measurements • Gauge measured on 100% solid and 1% process areas • 8 individual measurements for each area at each exposure combination • Entire study measured 448 solid and 448 screen readings at 3 washout rates, for a total of 2688 gauge readings
Comparison • 448 gauge readings at 100% solid and 448 gauge readings at 1% measured at each washout rate and averaged
Comparison +0.009 +0.012
Results • Decreasing wash rate causes longer dwell time in solvent • 250 mm/min = 4.0 min wash • 180 mm/min = 5.6 min wash (40% increase over recommended) • 120 mm/min = 8.3 min wash (108% increase over recommended) • Longer solvent dwell time causes more swelling, thereby extending the dry time
Solvent Wash Plates / 8 Hour Shift 20 Plates/8 hrs
Tank Draw Pump Machine • Solids Content Measuring
Machine • Controlled Brush Depth
Money • Optimized Wash = Optimized Dry • Optimized Solvent = Optimized Wash • Optimized Brushes = Optimized Plate • Optimized Plate = Optimized Production Time = Savings!
THANK YOU! David Chinnis Flint Group Printing Plates david.chinnis@plates.flintgrp.com 843-860-0454