Download
1 / 21
220 likes | 392 Views
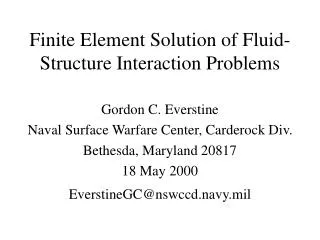
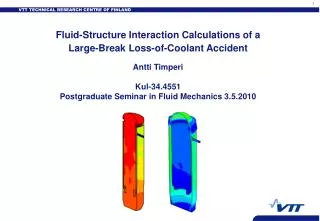
Fluid-Structure Interaction Calculations of a Large-Break Loss-of-Coolant Accident. Antti Timperi Kul-34.4551 Postgraduate Seminar in Fluid Mechanics 3.5.2010. Introduction.

E N D
Fluid-Structure Interaction Calculations of aLarge-Break Loss-of-Coolant Accident Antti TimperiKul-34.4551Postgraduate Seminar in Fluid Mechanics 3.5.2010
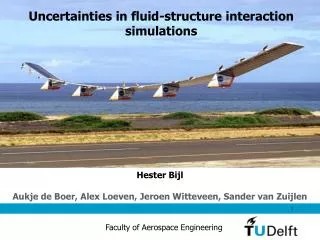
Introduction • Aim of the work has been to find practical tools for analyzing Fluid-Structure Interaction (FSI) problems found in nuclear and also other industries. • Large-Break Loss-Of-Coolant Accident (LBLOCA) is an important Design Basis Accident (DBA) situation. Rapid depressurization of the primary circuit causes loads on the reactor internals. • The motivation for studying more advanced simulation methods for analysis of DBA situations is to get more accurate, so-called ”best estimate”, analysis results. • LBLOCA in the VVER-440 type Pressurized Water Reactor (PWR) was used as a test case in earlier calculations. • Validation of LBLOCA calculations against the German HDR experiments is presented in the following.
HDR (Heißdampfreaktor) test facility vs. PWR p = 110bar Tcore = 308ºC Tdowncomer = 240ºC p = 125bar Thot leg = 295ºC Tcold leg = 265ºC
MpCCI Pressure loads Apros Boundary condition Abaqus Stresses and deformationof structures Star-CD Propagation ofpressure transient MpCCI Wall position Overview of the calculations • Motion of the core barrel is taken into account in the CFD calculation of pressure. • MpCCI (Mesh-based parallel Code Coupling Interface) is middleware that has been developed at the Fraunhofer Institute
Pressure at the break location,measured data and APROS calculations:
Star-CD CFD model • PISO (“Pressure Implicit with Splitting of Operators”) pressure correction algorithm. • Water is treated as compressible: • Crank-Nicholson method for temporal discretization and MARS/central/central-upwind differencing for spatial discretization. • Standard k-ε model and standard wall functions for modeling turbulence. ~ 78 000 hex cells
ABAQUS structural model • Fully linear model with ~ 15 0008-node hexahedral elements. • Continuum shell and solid elements are used for matching geometry between CFD and FEM. • Implicit Newmark direct time integration. • Small amount of stiffness proportional damping was included to the RPV wall:2 % of critical damping at frequency 1000 Hz.
CFD-FEM calculation • Explicit, sequential solution strategy, i.e. loose numerical coupling. Stable (usually) in LBLOCA calculations, but has been found unstable in certain other applications. • Interpolation is used for transferring the coupling quantities between the CFD and FEM meshes. • Coupling quantities local fluid pressure (CFD → FEM) and nodal coordinates (FEM → CFD). Data is exchanged in each time step (∆t = 10 μs). • Star-CD analysis has a moving mesh, internal CFD mesh is smoothed by mesh morpher of MpCCI.
CFD-FEM calculation (cont.) • Star-CD sends pressure load corresponding to initial conditions to ABAQUS. • ABAQUS simulation advances one time step. • ABAQUS sends new nodal coordinates to Star-CD. • Star-CD simulation advances one time step. • Star-CD sends new pressure load to ABAQUS. The sequence 2-5 is repeated for the duration of the simulation.
Acoustic-structural calculation • Models sound wave propagation and added mass effects, but effects of bulk flow, e.g. dynamic pressure, are neglected. Assumes small displacements. • Fluid is described as an acoustic medium (three-dimensional wave equation for pressure): • Linear constitutive behavior for the fluid (K is bulk modulus): • Reduces to Laplace equation for incompressible fluid (low-frequency structural motion):
Acoustic-structural calculation (cont.) • ”Volumetric drag” γ can be added to model bulk viscosity or resistive porous material: • Fluid pressure and structural displacement are coupled on the fluid-structure interface: • A single system of equations is solved, i.e. the fluid and structure domains are solved simultaneously:
Pressure in the reactor, CFD-FEM calculation: p [Pa] t = 5 ms 10 ms 15 ms 20 ms 25 ms
Stresses and deformations (x200), CFD-FEM calculation: s [Pa] t = 0 ms 5 ms 20 ms 40 ms 115 ms
Pressures, experiment vs. CFD-FEM: z = 8.850 m, = 90° z = 7.780 m, = 270° z = 5.550 m, = 90° z = 5.505 m (core)
Displacements of the core barrel, experiment vs. CFD-FEM: z = 7.150 m, = 90° z = 7.150 m, = 270° z = 5.550 m, = 90° z = 2.300 m, = 90°
Pressures, experiment vs. acoustic model: z = 8.850 m, = 90° z = 5.550 m, = 90° z = 5.505 m (core) z = 5.550 m, = 90°
Displacements of the core barrel, experiment vs. acoustic model: z = 7.150 m, = 90° z = 7.150 m, = 270° z = 2.300 m, = 90° z = 2.300 m, = 270°
Conclusions on CFD-FEM calculations • The calculated fluid and structural quantities were in fairly good agreement with the experiment. Especially the overall structural behavior of the core barrel was predicted well. • The most significant phenomena of the LBLOCA were well captured by the calculation during the first 100 ms, when the largest loads occurred. • Strong boiling increased pressure significantly after 120 ms, which caused deviation of measured and calculated pressures (single-phase CFD model was used).
Conclusions on acoustic-structural calculations • The results were in good agreement with the experiment and with the CFD-FEM calculation during the early phase of the simulation when the flow velocity was negligible. • Loads and structural effects were highly over-predicted in the later phase when the effect of bulk flow of water became significant. • The method is considerably more efficient and more robust compared to the CFD-FEM method. • May be considered as an alternative tool for comparison calculations in future work.
General conclusions • Fairly coarse numerical meshes were sufficient for capturing the most important fluid transient and FSI phenomena. • The single-phase assumption used in the FSI calculations was adequate during the phase when the largest structural effects occurred, i.e. until ~ 100 ms. • The experiment had probably an unrealistically short break opening time, i.e. ~ 1 ms. Opening times of 15 ms and longer have been proposed in the literature.