Download
1 / 7
70 likes | 291 Views
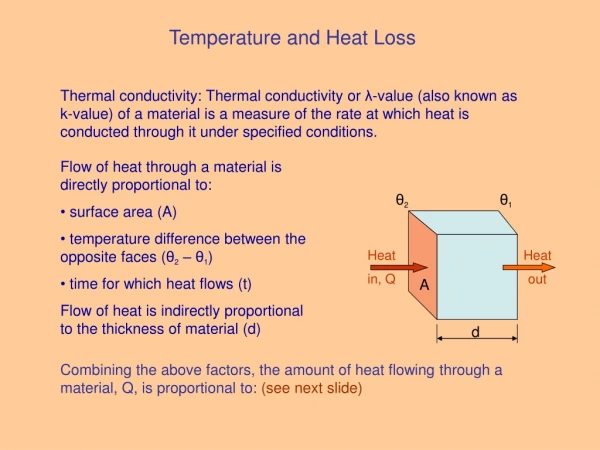
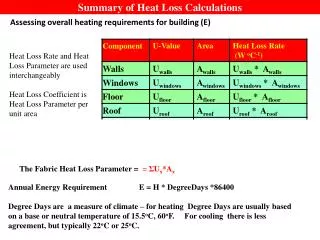
Summary of Heat Loss Calculations. Assessing overall heating requirements for building (E). Heat Loss Rate and Heat Loss Parameter are used interchangeably Heat Loss Coefficient is Heat Loss Parameter per unit area. The Fabric Heat Loss Parameter = = Σ U x * A x.

E N D
Summary of Heat Loss Calculations Assessing overall heating requirements for building (E) Heat Loss Rate and Heat Loss Parameter are used interchangeably Heat Loss Coefficient is Heat Loss Parameter per unit area The Fabric Heat Loss Parameter = = ΣUx*Ax Annual Energy Requirement E = H * DegreeDays *86400 Degree Days are a measure of climate – for heating Degree Days are usually based on a base or neutral temperature of 15.5oC, 60oF. For cooling there is less agreement, but typically 22oC or 25oC.
Summary of Energy Management in Buildings Energy Management in Buildings - Heating • Do not include points > 15.5oC when defining trend line, • Red trend line may be used to predict future consumption, • Blue line takes account of efficiency of boiler, • Gradient of Blue Line is measured in kWh / day / oC • Divide by 24 (hrs) to get in kW and the gradient should be identical with Heat loss parameter • i.e. bottom up and top down approaches should give same answer. Dashed Purple Line shows possible revised heat loss parameter after insulation improvement – e.g. double glazing Dotted Black Line shows equivalent actual consumption after insulation measures -can be compared with actual consumption i.e. in this example actual savings are not what had been predicted
Summary of Energy Management in Buildings Energy Consumption Heating Base Load Temperature
Summary of Energy Management in Buildings Case with an electrically heated and cooled building – e.g. Shanghai Energy Consumption Heating Cooling Base Load Temperature
Monitoring Performance – Gas • Identify when consumption deviates significantly from trend line • 1.5 standard deviations is a good starting point
Electricity Consumption in an Office Building in East Anglia Low Energy Lighting Installed • Consumption rose to nearly double level of early 2005. • Malfunction of Air-conditioning plant. • Extra fuel cost £12 000 per annum ~£1000 to repair fault • Additional CO2 emitted ~ 100 tonnes.
Performance of ZICER Building 800 350 Good Management has reduced Energy Requirements Space Heating Consumption reduced by 57% CO2 emissions reduced by 17.5 tonnes per annum. 7 7