Download
1 / 54
540 likes | 569 Views
Explore how rapid urbanization affects agricultural vulnerability in China, analyze various factors like land conversion and climate change, and propose solutions. Utilize spatial data, economic analysis, and estimation systems to measure impacts.

E N D
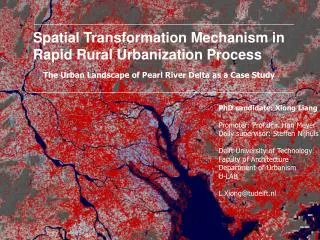
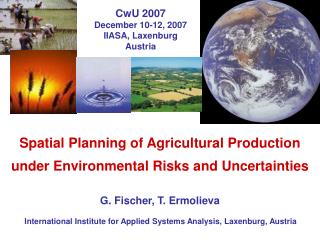
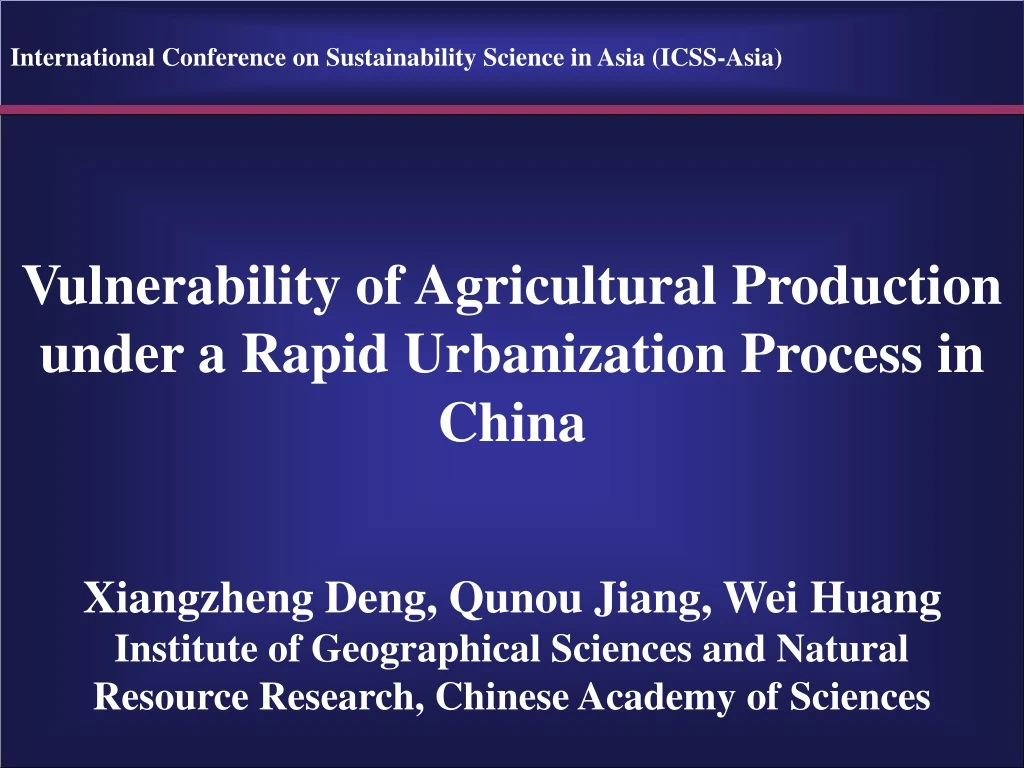
International Conference on Sustainability Science in Asia (ICSS-Asia) Vulnerability of Agricultural Production under a Rapid Urbanization Process in China Xiangzheng Deng, Qunou Jiang, Wei Huang Institute of Geographical Sciences and Natural Resource Research, Chinese Academy of Sciences
Factors leading to vulnerability for agricultural production • Climate changes • Natural disaster • Losses of agricultural lands • Increased activity of insects • Spreading of plant diseases • Agricultural waste disposal • Urbanization
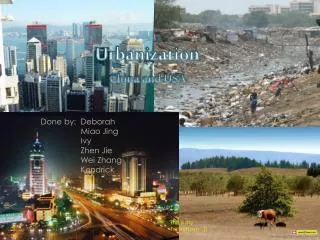
Rapid urbanization leading to vulnerability for agricultural production • Rapid urbanization is identified by the conversion of agricultural lands to housing and other nonfarm uses • By perception, this conversion will challenges our long-term capacity to provide food, fiber and ecosystem services to a growing world population.
China’s cereal yield(10kg/ha), and production (million tons) After 1998 Prod: -18% Yield: stagnant
China’s cereal sown area (million ha) The fall of sown area after 1998, As generated the concern of China’s government
Issues related with the vulnerability of agricultural production associated with the rapid urbanization process • Has cultivated land declined due to the urban land expansion sharply? How has this affected grain production in the past? • Is the urban land expansion contributing to the loss of cultivated area? What is the potential impacts of urban land expansion on agricultural production? • How does the urban land expansion lead to vulnerability of agricultural production?
Goals of Presentation • Measure the impacts on agricultural production from urban land expansion • Identify the spatial heterogeneity of urban land expansion process as well as the vulnerability of agricultural production • Explore the relationship between vulnerability of agricultural production and factors related with the urban land expansion
Data and methods • Remote sensing data (RSD) identifying land uses • Derived from Landsat TM/ETM, 1988, 1995, 2000 and 2005 • Organized as one area percentage dataset • Meteorological data • Raw record derived from the China Meteorological Administration • Surface data • Soil attribute data • Derived from the second round of nationwide soil survey • Terrain condition data • Slope, elevation, landform • Social and economic data • Population density ,GDP, Agricultural Investment, fertilizer uses
Data and methods • Use an estimation system for agricultural productivity (ESAP) to measure the impacts on agricultural production from urban land expansion • Use an analytical hierarchical process (AHP) approach to explore the spatial heterogeneity of the vulnerability of agricultural production • Use an econometric method to explore the relationship between the vulnerability of agricultural production and factors related with the urban land expansion
Measure the impacts on agricultural production from the urban land expansion
Urban Growth of Chengdu, the capital of Sichuan province, China Orange area: Newly expanded built up area (most of it on cultivated land) between 1990 and 2000 Urban Core – 1990
Rural patches = Urban core Urban sprawl In this study, we only examine “urban core”
Using 1-km APDM to describe China’s land conversions • 1-km APDM: a new technique to convert vector data into a series of grid data with 1 km resolution without losing detailed acreage information • Three steps • build up a standard grid frame with vector format and make each grid cell with 1 by 1 km scales and identified with a unique ID. • use the frame to intersect with the vector data of land uses to allocate all layers of land uses/land use changes into each cell. • provide a summary of area, length, etc. for each cell group by class or level. • Each cell with 1 km2 area contains the land conversion information, e.g., cultivated area in 1988/2000/2005 and the conversion between cultivated land and other land cover types.
Spatial variation of land uses and temporal changes represented by 1-APDM data 1988/138.5Mha 2000/141.1Mha Cultivated land Forestry area Grassland Built-up area +2.6 Mha -1.1 Mha -3.5 Mha +1.8 Mha Net changes of area (ha) in each 10 by 10 kilometers, 1988-2000
Spatial variation of land uses and temporal changes represented by 1-APDM data 2000/141.1Mha 2005/140.5Mha Cultivated land Forestry area Grassland Built-up area -0.64 Mha +0.21 Mha -1.42 Mha +1.70 Mha Net changes of area (ha) in each 10 by 10 kilometers, 2000-2005
China’s land conversions under the rapid urbanization process, 1988-2000 Total reduction: 2.6 million ha, or 1.9% New uses: - Built-up Area (47%); Forestry area (17%); - Grassland (22%); Water area (11%); Unused land (5%) Total addition: 5.2 million ha, or 3.8% Sources: - Built-up Area (0%); Forestry area (29%) - Grassland (55%); Water area (4%); Unused land (11%)
China’s land conversions under the rapid urbanization process, 2000-2005 Total reduction: 2.7 million ha, or 1.5% New uses: - Built-up Area (49%); Forestry area (17%); - Grassland (20%); Water area (12%); Unused land (2%) Total addition: 2.1million ha, or 1.2% Sources: - Built-up Area (0%); Forestry area (18%) - Grassland (57%); Water area (7%); Unused land (18%)
Urban land expansion identified at the 1km*1km GRID scale, 1988-2000
Urban land expansion identified by the 1km*1km GRID scale, 2000-2005
Growth rate of Built-up area (BuA) Growth rate = Newly expanded area (88-00)/BuA (1988)
Growth rate of Built-up area (BuA) Growth rate = Newly expanded area (00-05)/BuA (2000)
Urban land expansion by provinces (10^3 ha) 1988 to 2000
Urban land expansion by provinces (10^3ha) 2000 to 2005
Spatial heterogeneity of the growth rate of the BuA (1988-2000) • Urban land expanded by 1.7 million ha, or 3.84% • With a share of 0.18% of total land area • The following regions featured by dramatic urban land expansion • North China Plain (Beijing and Tianjin) • East and Southeast areas • - Lower Yangtze River Delta (Shanghai, Jiangsu) • - Pearl River Delta (Guangdong) • Inland areas • Sichuan Basin • Xinjiang and other NW provincial capitals
Spatial heterogeneity of the growth rate of the BuA (2000-2005) • Urban land expanded by 1.68 million ha, or 3.66% • With a share of 0.18% of total land area • The following regions featured by dramatic urban land expansion • North China plain (Beijing, Tianjin, Shandong) • East and Southeast areas • - Lower Yangtze River Delta (Zhejiang, Shanghai) • - Pearl River Delta (Guangdong) • Inland areas • Sichuan Basin (Sichuan, Chongqing) • Ningxia, Shaanxi, Xinjiang
Spatial heterogeneity of the agricultural productivity of China, estimated based on ESAP Unit: ton/ha
Increase of agricultural production associated with changes in cultivated land by provinces, 1988-2000 Unit:10^3 ton
Increase of agricultural production associated with changes in cultivated land by provinces, 2000-2005 Unit:10^3 ton
Decrease of agricultural production associated with changes in cultivated land by provinces, 1988-2000 Unit:10^3 ton
Decrease of agricultural production associated with changes in cultivated land by provinces, 2000-2005 Unit:10^3 ton
Net change of agricultural production associated with changes in cultivated land by provinces, 1988-2000 Unit:10^3 ton
Net change of agricultural production associated with changes in cultivated land by provinces, 2000-2005 Unit:10^3 ton
Percentage change of agricultural production due to land conversions in the period between 1988 and 2000
Percentage change of agricultural production due to land conversions in the period between 2000 and 2005
Impacts on the agricultural production from the urban land expansion in the period between 1988 and 2000 Changes of Ag productivity by Provinces, 1988-2000 Land Conversions in China, 1988-2000 • Changes of ag production: • decreased by 2.2% (1988-2000); • 0.14% per year on average • Regional differences: • North China Plain (Beijing, Hebei); Eastern coastal areas (Shanghai, Jiangsu, Zhejiang, Shandong) • South China (Guangdong); Sichuan Basin (Sichuan, Chongqing) • Inner Mongolia, Ningxia
Impacts on the agricultural production from the urban land expansion in the period between 2000 to 2005 Changes of Ag productivity by Provinces, 2000-2005 Land Conversions in China, 2000-2005 • Changes of ag production: • decreased by 1.58% (2000-2005); • 0.10% per year on average • Regional differences: • North China Plain (Beijing, Tianjin); Eastern coastal areas (Shanghai, Jiangsu, Zhejiang, Shandong) • South China (Guangdong); Sichuan Basin (Sichuan, Chongqing) • Xinjiang, Inner Mongolia, Ningxia • Northeast plain (Heilongjiang, Jilin)
Explore the spatial heterogeneity of vulnerability of agricultural production
Factors selected for vulnerability assessment for agricultural production
Spatial heterogeneity of vulnerability gradients 2005 2000 1988 High Low
Explore the “causality” between vulnerability of agricultural production with the relevant factors associated with rapid urbanization process
Gain and loss of cultivated land area along with the cultivated land quality (CLQ) gradients, 1988-2000 New cultivated area Lost cultivated area Comparing the change of “quality” of cultivated land that was converted to other uses with the “quality” of newly expanded cultivated area in China, 1988-2000
Gain and loss of cultivated land area along with the cultivated land quality (CLQ) gradients, 1988-2000 New cultivated area Lost cultivated area Comparing the change of “quality” of cultivated land that was converted to other uses with the “quality” of newly expanded cultivated area in China, 2000-2005
Causality function to be estimated Vulnerability = f( urban land expansion, agricultural productivity, economic growth, population, Z) Z include a couple ofinfluencing factors, e.g., rainfall, temperature, elevation, terrain slope, soil pH, soil organic matter, loam, distance to expressway, distance to mega cities, …
Results by using the Logit estimator Ordinal Logit Model:
Estimates of the marginal effects from the relevant factors, 1988-2000
Estimates of the marginal effects from the relevant factors, 2000-2005