Download
1 / 39
400 likes | 522 Views
Performance of Remote Offshore Photovoltaic (PV) Generation System. M.H. Shwehdi , A. Al Nuaim , and Fahd Al samail Electrical Engineering Department King Fahd University of Petroleum & Minerals Dhahran, Saudi Arabia. Outlines. INTRODUCTION OBJECTIVES PV SYSTEM SIZING

E N D
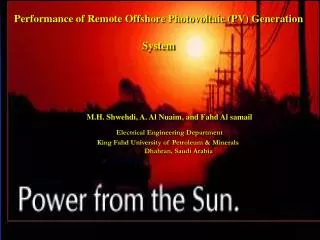
Performance of Remote Offshore Photovoltaic (PV) Generation System M.H. Shwehdi, A. Al Nuaim, and Fahd Al samail Electrical Engineering Department King Fahd University of Petroleum & Minerals Dhahran, Saudi Arabia
Outlines • INTRODUCTION • OBJECTIVES • PV SYSTEM SIZING • Load Modeling • Battery Model • PV Panels Modeling • DESIGN METHODS • LOLP & LOEP Method • Fixed Autonomy and Recharge Method • Markov Chain Probabilistic Modeling • CASE STUDIES & RESULTS • CONCLUSION
Introduction • This presentation is concerned with the probabilistic sizing of Photovoltaic systems supplying power to remote offshore loads. • Utility services of offshore facilities may be supplied from either commercial or industrial (in-house generation) utilities.In the case of commercial supply, the power is supplied from the nearest onshore substation through submarine cables.
In the case of industrial supply, remote power systems are installed in offshore facilities. These could be wind turbines, thermal generators or photovoltaic cells. • However, such remote power supplies are usually limited in power capacity. Moreover, the PV is seasonal and requires large space. • Due to such limitations, some remote load customers mandate that such systems be supported by battery back up which will provide the required power supply in the inclement of bad weather for a minimum number of days.
also mandated that the PV panels be capable of charging the batteries within a maximum number of days to guarantee that the next cycle of bad weather will not lead to loss of load. • The period (for which this battery back up is to independently supply the load) should be based on the expected number of consecutive days of bad weather per year. • The period (for which the panels are to recharge the batteries fully) should be based on the minimum number of "good" weather days between two cycles of bad weather.
Probabilistic Methods • The objective in the design of a PV system is to provide reliable power supply to the load without interruptions and without wasting energy. • Several methods for evaluating the achievement of the above objective were found in the literature. • One approach is proposed for evaluating different PV schemes taking into consideration the random characteristics of the solar radiation and the load. • The reliability indices proposed are loss of load hours (LOLH), the energy loss and the total cost.
Another method suggested is System Performance Level (SPL) as a reliability index. It is defined as the number of days load cannot be satisfied expressed in terms of probability. • Although similar in principle to LOLP (loss of Load Probability), it is based on Markov Chain Modeling of the solar radiation.
Objectives & Approach • The of this paper is to demonstrate that the required Autonomy and Recharge time calculated based on Loss of Load Probability, are less than those mandated by the operating organization and may lead to a PV system design of a smaller size. • If this design, if implemented, will lead to reducing the cost of the remote power system and its associated structures. • Is to briefly describes the steps involved in sizing a PV system and then will list different indices used to measure the performance of a PV system. • Three programs written in Matlab to implement these methods will be presented. • Comparisons of the usefulness and consistency of these methods through application to a known case of a PV system that fails to supply the load because of its size. • The differences between the three methods and the proposed LOLP probabilistic method is presented.
Some Solar Energy, Realistic facts, existing plants and Nature
What is Solar Energy? • Originates with the thermonuclear fusion reactions occurring in the sun. • Represents the entire electromagnetic radiation (visible light, infrared, ultraviolet, x-rays, and radio waves). • It is random in nature, time, intensity, etc…
Advantages and Disadvantages • Advantages • All chemical and radioactive polluting by products of the thermonuclear reactions remain behind on the sun, while only pure radiant energy reaches the Earth. • Energy reaching the earth is incredible. By one calculation, 30 days of sunshine striking the Earth have the energy equivalent of the total of all the planet’s fossil fuels, both used and unused! • Disadvantages • Sun does not shine consistently. • Solar energy is a diffuse source. To harness it, we must concentrate it into an amount and form that we can use, such as heat and electricity. • Addressed by approaching the problem through: 1) collection, 2) conversion, 3) storage.
How much solar energy? The surface receives about 47% of the total solar energy that reaches the Earth. Only this amount is usable.
Solar-Thermal Electricity: Power Towers • General idea is to collect the light from many reflectors spread over a large area at one central point to achieve high temperature. • Example is the 10-MW solar power plant in Barstow, CA. • 1900 heliostats, each 20 ft by 20 ft • a central 295 ft tower • An energy storage system allows it to generate 7 MW of electric power without sunlight. • Capital cost is greater than coal fired power plant, despite the no cost for fuel, ash disposal, and stack emissions. • Capital costs are expected to decline as more and more power towers are built with greater technological advances. • One way to reduce cost is to use the waste steam from the turbine for space heating or other industrial processes.
Power Towers Power tower in Barstow, California.
Solar-Thermal Electricity:Parabolic Dishes and Troughs • Focus sunlight on a smaller receiver for each device; the heated liquid drives a steam engine to generate electricity. • The first of these Solar Electric Generating Stations (SEGS) was installed in CA by an Israeli company, Luz International. • Output was 13.8 MW; cost was $6,000/peak kW and overall efficiency was 25%. • Through federal and state tax credits, Luz was able to build more SEGS, and improved reduced costs to $3,000/peak kW and the cost of electricity from 25 cents to 8 cents per kWh, barely more than the cost of nuclear or coal-fired facilities. • The more recent facilities converted a remarkable 22% of sunlight into electricity.
Parabolic Dishes and Troughs Collectors in southern CA. Because they work best under direct sunlight, parabolic dishes and troughs must be steered throughout the day in the direction of the sun.
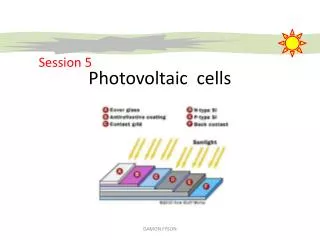
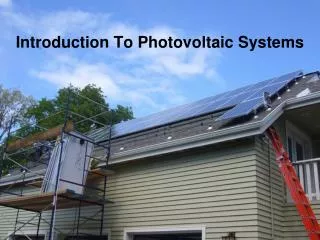
Direct Conversion into Electricity • Photovoltaic cells are capable of directly converting sunlight into electricity. • A simple wafer of silicon with wires attached to the layers. Current is produced based on types of silicon (n- and p-types) used for the layers. Each cell=0.5 volts. • Battery needed as storage • No moving partsdo no wear out, but because they are exposed to the weather, their lifespan is about 20 years.
Solar Panels in Use • Because of their current costs, only rural and other customers far away from power lines use solar panels because it is more cost effective than extending power lines. • Note that utility companies are already purchasing, installing, and maintaining PV-home systems (Idaho Power Co.). • Largest solar plant in US, sponsored by the DOE, served the Sacramento area, producing 2195 MWh of electric energy, making it cost competitive with fossil fuel plants.
Efficiency is far lass than the 77% of solar spectrum with usable wavelengths. 43% of photon energy is used to warm the crystal. Efficiency drops as temperature increases (from 24% at 0°C to 14% at 100°C.) Light is reflected off the front face and internal electrical resistance are other factors. Overall, the efficiency is about 10-14%. Cost of electricity from coal-burning plants is anywhere b/w 8-20 cents/kWh, while photovoltaic power generation is anywhere b/w $0.50-1/kWh. Does not reflect the true costs of burning coal and its emissions to the nonpolluting method of the latter. Underlying problem is weighing efficiency against cost. Crystalline silicon-more efficient, more expensive to manufacture Amorphous silicon-half as efficient, less expensive to produce. Efficiency and Disadvantages
PV SYSTEM SIZING • The PV system components are shown in Figure. • CHARGER/RGULATORLOAD PANELS BATTERIES • The sizing process of PV systems involves three models: • Load Modeling • Battery Model • PV Panels Modeling
Load Modeling • The load consists of three components. • Ampere-Hours (AH) consumption during the day-hours is presented as given in Equation (1). • LD = HL* L (1) • AH to be supplied during the night by the batteries and should be charged by the panels during the day as given in Equation (2). • BSR= LN* BI (2) • AH required to charge the battery to 100% during a specified number of recharge days in anticipation of next cycle of consecutive days of bad weather is presented as given in Equation (3). • BLR= ((BCx0.8)-LN)*BI/TR (3) • Where; • LD: Daytime load demand, AH • HL: Minimum number of light hours per day, Hours • L: System Load, Amps • BSR: Battery short-term reserve (night reserve), AH • LN: Night load demand, AH • BLR: Battery long term reserve (autonomy), AH • BC: Battery Capacity, AH • BI: Battery efficiency • TR: Specified recharge time, Days
Battery Model • A typical formula used to calculate the battery capacity BC is as given in Equation(4). • It should be noted that the 1.25 factor is used to ensure that the battery is to allow for the battery to supply the load without discharging beyond its physical limit. • BC = F x TA x L x 1.25 (4) • where ; • F: Design factor that include temperature compensation, uncertainties in data and aging in the battery • TA: Back-up time required (autonomy)
PV Panels Modeling • This involves determining the number of solar panels required to supply power for the three load compnents mention above. The formula used is given in Equation (5): • PS = Phmin x A (5) • Where: • PS: single panel power output, AH/Day • Phmin: Minimum hours of peak power per day of solar radiation • A: single panel current output, Amps • Due to the limitation in power output per panel, several panels may need to be connected in parallel in order to produce the required power. The total power output of the panels should be enough to Supply the daily load, charge the batteries to supply the evening load and recharge the batteries to 100% SOC (state of charge) after certain number of recharge days. • The formula proposed to calculate the number of panels is given in Equation (6): • N = ceiling { [BLR +BSR +LD] / PS} (6) • Where; • N is the number of panels • Ceiling: is the ceiling function, ceiling (2.5) = 3, ceiling (2.4)=3
DESIGN METHODS; LOLP & LOEP Method • LOLP is defined as the probability of not being able to supply the load per day per year, measured in AH of lost load or Hours of lost load, given a PV system with certain number of panels and battery capacity. • A computer program was written in MATLB to calculate the LOLP of a given PV system design as shown previously. • LOEP is the loss of energy probability and it measures the amount of energy lost from the solar panels due to the inability to charge the battery beyond its actual maximum capacity. • The method used to calculate this index is the same as with the LOLP but with replacing lost load in Fig.2 with lost energy.
Autonomy and Recharge Method • This is concerned with the case when the batteries are at a SOC between the minimum and the maximum capacity of the battery (capable of supplying the load for X number of hours) and actual de-rated total panel output is less than the daily load for a number of days Z that is greater than X. • In this case, the batteries will discharge completely (supplying the deficiency in load) before the solar radiation improve to supply the daily load and recharge the batteries. Hence, loss of load will occur. • The design based on this method uses a battery back-up time equivalent to the maximum number of consecutive days for which the actual de-rated total panel output is less than the daily load and a recharge-time equivalent to the minimum number of "good weather" days between two cycles of "bad weather". As shown in Fig.3
This is associated with calculating the probability that, given a certain state of battery capacity and solar radiation, the PV system will fail to supply the load due to the inability of the PV system to supply the load during the day (hence utilizing the battery reserve) and/or the inability of the batteries to supply the load during the night due to depletion of its stored power. • The index calculated by this method is SPL and it measures the probability that a system will fail to supply the load due to the occurrence of a qualifying incident (defined by two solar radiation levels occurring consecutively with a battery SOC of such value that the PV system cannot supply the load). • The probability is calculated via Markov chain matrix of solar radiation. A computer program was written in MATLB to calculate the SPL of a given PV system design as shown in Fig.4
CASE STUDIES & RESULTS • The previous methods were applied to the case studies.. Results are summarized in Table-1. • Case-1: Existing System Verification • The first case has evaluated the performance of an existing PV system that is known to be deficient in supplying the load using the above three methods. • First, the autonomy and recharge of the existing system was calculated using Method 2. • Second, LOLP and LOEP were calculated using LOLP method. Third, SPL was calculated using Markov Chain Probabilistic modeling.
Where; SPL: System Performance Level F: System Failure MPO: Mean Power Output MLD: Mean Load Demand MC: Markov Chain Method
All three methods were successful in showing that the existing system is incapable of supplying the load. • However, the Fixed Autonomy & Recharge method results were misleading. • The recharge days calculated were negative which could have been interpreted as "no time" to recharge the batteries. • However, it is evident that negative recharge days can happen only if the battery capacity is less than the night load or the panel output is less than the daily load and AH required to charge the battery for the next evening.
Case-2: PV Sizing Based On None-Probabilistic Method • The second case considered the effect of sizing the system based on Fixed-Autonomy and Recharge. • A predetermined fixed Autonomy and a certain number of Recharge days were used to size the batteries and the solar array. • The designed system has shown acceptable performance when evaluated using Markov Chain and LOLP methods. • However, the energy waste is tremendous. LOEP was found to be 417 AH. This can also be deduced from the Average Power Output Vs Average Load Demand , being 43 Vs. 32, respectively
Case-3: PV Design Based on Markov Chain Probabilistic Method • The third case considered sizing the system based on Markov Chain Probabilistic Modeling. • The program was modified to execute in an iterative loop. The routine was fed initial values of autonomy and recharge days. • The SPL was calculated for each resulting PV system and the result compared with a desired SPL ( SPL=1 corresponding to 365 days of guaranteed power supply). If the level is achieved, the execution is halted. If not, the autonomy is incremented by a specified step level and the calculation is repeated until the desired SPL is achieved. • The designed system has shown acceptable performance when evaluated using LOLP and Fixed Autonomy & Recharge methods. • IN addition, the energy lost decreased from 417 in Case-2 to 53 in Case-3. Moreover, the number of recharge days improved to 0.5 day from 4 days in Case-2. This is due to the reduction in the battery size required from 721 AH to 40.8 AH.
Case-4: PV Design Based on LOLP Probabilistic Method • The fourth case considered sizing the system based on LOLP. • The designed system has shown acceptable performance similar to Case-3 when evaluated using Markov Chain Modeling and Fixed Autonomy & Recharge methods. • All parameters and results are the same.
CONCLUSION • The most reliable and optimum method to size the PV system has been found to be the LOLP method. • This method has shown advantages in the following areas: (1) LOLP provides the energy flow per unit time. This will allow the user to decide if the period of lost load is important or not as far as timing and duration are concerned. • The LOLP methods are not provided by the Markov Chain Modeling as the exact duration of lost load for a particular system. • Furthermore, the Fixed Autonomy and Recharge method will not tell you the battery state of charge at the end of each unit of time. • Moreover, the Average Power Output / Mean Load Demand index provided by LOLP will provide a general idea about the energy flow and waste but does not indicate how many days of lost load are expected. • However, one disadvantage of the LOLP is it’s tedious calculations.
Final Thought • Argument that sun provides power only during the day is countered by the fact that 70% of energy demand is during daytime hours. • At night, traditional methods can be used to generate the electricity. • Goal is to decrease our dependence on fossil fuels. • Currently, 75% of our electrical power is generated by coal-burning and nuclear power plants. • Mitigates the effects of acid rain, carbon dioxide, and other impacts of burning coal and counters risks associated with nuclear energy. • pollution free, indefinitely sustainable.
This Presentation is dedicated to the Pure Soul of Gassan Ghassan K. Al-Bassam was born Taif, Saudi Arabia. He graduated from King Fahd University of Petroleum and Minerals in 1992 with a B. Sc. In Electrical Engineering. He has been awarded the Prince Mohammed Bin Fahd Award for educational Excellence in 1992. He has also received the Key contributor award from Honeywell, Industrial Automation & Control in 1998. He has worked on several power and control systems projects in Saudi Aramco. He is a part time graduate student at KFUPM and works as a project engineering Saudi Aramco Oil Company providing support to electrical, instrumentation and control systems for offshore projects. In 2002 Gassan finished his MSc degree in EE from KFUPM with Honors, he was taken back to Almighty in 2004.