A cost-effectiveness framework for profiling hospital efficiency
140 likes | 341 Views
A cost-effectiveness framework for profiling hospital efficiency. Justin Timbie AcademyHealth Annual Research Meeting June 5, 2007 Walt Disney World “Dolphin”. Acknowledgements. Sharon-Lise Normand 1,2 Joe Newhouse 1 Meredith Rosenthal 3

A cost-effectiveness framework for profiling hospital efficiency
E N D
Presentation Transcript
A cost-effectiveness framework for profiling hospital efficiency Justin Timbie AcademyHealth Annual Research Meeting June 5, 2007 Walt Disney World “Dolphin”
Acknowledgements Sharon-Lise Normand1,2 Joe Newhouse1 Meredith Rosenthal3 1Department of Health Care Policy, Harvard Medical School 2Department of Biostatistics, Harvard School of Public Health 3Department of Health Policy & Management, Harvard School of Public Health
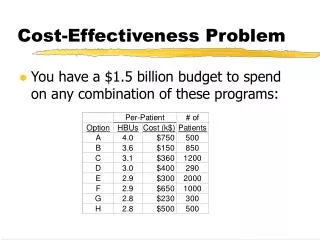
Context • Interest in efficiency measurement following growth of P4P. • 42% of commercial HMOs use cost information (Rosenthal, 2005) • DRA of 2005 requires Medicare to implement value based purchasing for hospital services by FY’09. • Efficiency measures to be included in FY’10-11. • Measuring appropriateness and efficiency are both challenges.
Examples of efficiency metrics • Dartmouth Atlas: population-based efficiency: • Medicare spending (last 2 years of life) • Resource inputs: beds, physician FTE inputs • Utilization: hospital/ICU days, physician visits • Leapfrog Group: risk-adjusted LOS, readmission rates within 14 days. • National Quality Forum: focusing on LOS and readmission. • Medicare: MEDPAC considering publicly reporting hospital readmission rates.
Measurement challenges • Defining efficiency: Focus on payment or resource use (LOS, readmission rates, RVUs). • DRG-based payment makes hospital efficiency profiling different. • Limited ability to measure inpatient resource use. • Duration of efficiency, quality measurement. • Longer duration is desired. • Causes attribution difficulties (PAC providers). • Weighting of cost vs. quality. • Binary (threshold) scoring approaches weight domains equally. • Measuring performance continuously allows tradeoffs.
Study design • Objective: Compare efficiency of hospital care following acute myocardial infarction (AMI). • Motivation: Channeling patients to high-value hospitals for specific conditions. • Outcomes: In-hospital survival, hospital costs. • Data source: Massachusetts all payer data. • 69 hospitals (11,259 patients) in FY’03. Efficiency = Health benefit relative to cost
Methods - Cost measurement • Used total hospital charges and global cost-to-charge ratios. • Costs derived from charge data remove price variation. • Use of global cost-to-charge ratios may confound estimates due to differential markup across revenue centers. • Used in-hospital outcomes, although 30-day outcomes are preferred. • Lacking post-acute care costs, costs of procedures.
Methods - Estimation • Link inter-hospital transfers to create inpatient “episodes.” • Estimate “predicted” outcomes. • Fit hierarchical models. • Condition on hospital-specific effect, risk factors. • Estimate “expected” outcomes. • Condition on population mean effect, risk factors.
Methods - Combining measures • Incremental outcomes: ΔEi = Predicted survivali – Expected survivali ΔCi = Predicted costi – Expected costi • Incremental Net Health Benefits (INHB): • Estimate P(INHB > 0) • Identify efficient hospitals using relative or absolute threshold. INHBi = ΔEi – ΔCi/ where = WTP/ΔE = $5M/Life saved
Results – Threshold Scoring 88 90 92 94 Standardized Survival (%) 15,000 20,000 25,000 30,000 35,000 Standardized Cost (dollars)
Results - Cost-effectiveness 88 90 92 94 Standardized Survival (%) 15,000 20,000 25,000 30,000 35,000 Standardized Cost (dollars)
Sensitivity of INHB estimates to 0.0 0.2 0.4 0.6 0.8 1.0 P (INHB > 0) 0 1 2 3 4 5 Willingness to Pay Threshold (Million $/Life Saved)
Summary • Proposed an economic approach to measuring efficiency using a composite measure. • Theoretically strong and objective weighting mechanism. • Results will differ from threshold model due to ability to incorporate tradeoffs. • Difficult to agree on single WTP value. • LY and QALY measures of benefit are more promising.
Future work • Longitudinal analysis. • Inclusion of AMI process measures, quality of life. • Developing willingness to pay values that reflect multiple outputs (benefits). • Refining cost measure to include RVUs. • Exploring a composite measure of hospital efficiency.