
Hydrologic Connectivity of Rio Grande and Riparian Groundwater: A Study at Two Sites
This study investigates the hydrologic connectivity between the Rio Grande and shallow riparian groundwater at two sites in Albuquerque, utilizing continuous water table measurements and slug tests. Our findings reveal that shallow groundwater levels are responsive to fluctuations in river discharge, with response times ranging from 2 to 18.5 hours depending on the season. Additionally, we observed the changes in groundwater equipotential maps throughout the year, indicating significant differentiation influenced by season, evapotranspiration, and proximity to the river.

Hydrologic Connectivity of Rio Grande and Riparian Groundwater: A Study at Two Sites
E N D
Presentation Transcript
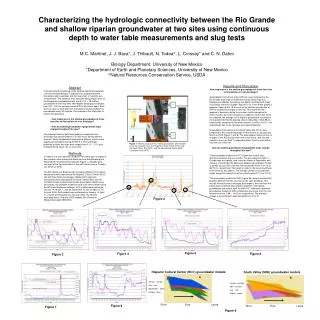
Characterizing the hydrologic connectivity between the Rio Grande and shallow riparian groundwater at two sites using continuous depth to water table measurements and slug tests M.C. Martinet, J. J. Baca*, J. Thibault, N. Todea^, L. Crossey* and C. N. Dahm Biology Department, University of New Mexico *Department of Earth and Planetary Sciences, University of New Mexico ^Natural Resources Conservation Service, USDA • Results and Discussion • How responsive is the shallow groundwater at these two sites to fluctuations in river discharge? • Groundwater fluctuations at the SHK site were compared to the Rio Grande discharge for 4 different months 2003 (Figure 2). Shallow groundwater fluctuations are tightly correlated with stage fluctuations of the Rio Grande (Figures 3 - 6). From these graphs it appears it takes 8.5 to 18.5 hours for the shallow groundwater at SHK to respond to changes in the river. This response time appears to decrease during the summer months compared to winter months, but further analysis is needed to confirm this trend. As expected, the average (n=3) depth of groundwater fluctuations were greatest during the growing season (May/Sep, 2.38/4.65 cm, respectively) compared to the winter season (Jan/Nov, 0.6/0.17 cm respectively) due to the influence of evapotranspiration. • Groundwater fluctuations at the South Valley Site (HCC) were compared to Rio Grande discharge for the months of January and March of 2005 (Figure 7 and 8). The groundwater response time to changes in the Rio Grande were from 2 to 6 hours, with the well closest to the river (Well 7) responding faster then the well farther from the river (Well 10). • How do shallow groundwater equipotential maps change throughout the year? • The groundwater models for HCC (Figure 9a) show a clear distinction between the four months. The groundwater height in October was the highest, and it was the lowest in September and January. Interestingly, the difference between groundwater models is greater as you move from the river toward the levee, from 14 to 56.19 cm, respectively. The height of water in the levee could have some effect on this pattern. The average change in groundwater height along this transect for all four months was 67.17 cm (2.2 ft). • The groundwater models for SHK (Figure 9b) show less distinction between different months (as seen by the color blending). This may be the result from continuous discharges to the river from the waste water treatment plant effluent upstream. The highest groundwater occurred in April. As with HCC, differences between groundwater models at SHK increased as you move from the river toward the levee, 5.98 – 14.20 cm, respectively. The average change in groundwater height was 66.86 cm (2.19 ft). • Abstract • Characterizing the hydrology of the shallow riparian groundwater of the Rio Grande Bosque is important for understanding the interactions with vegetation and the movement of nutrients and contaminants. Two research sites along the Albuquerque reach of the Bosque were established with a grid of 14 – 19 shallow groundwater monitoring wells. Well depths below ground ranged from 150 – 330 cm and were spaced 30 to 40 meters apart. Each site has a pair or more pressure transducers measuring depth to groundwater every 30 minutes. The purpose of this study was to answer two questions: • How responsive is the shallow groundwater at these two sites to fluctuations in river discharge? • How do shallow groundwater equipotential maps change throughout the year? • Groundwater levels at both sites appear to respond to river discharge fluctuations between 2 to 18.5 hours during different seasons. Water equipotential maps during different months were graphed and compared using ArcGIS 9.0. The hydrologic gradients at these two sites were ranged from 0.1% - 1.2% and changed during heavy rain or snow melt. Figure 1. General Layout of the shallow groundwater well networks at the two research sites, the Hispanic Culture Center (HCC) and the South Valley Site (SHK), and the Albuquerque Waste Water Treatment Plant (WTP). Methods A network of 2-inch diameter (5.08 cm) PVC wells were installed at two research sites upriver and downriver from the Albuquerque’s Waste Water Treatment Plant effluent (Figure 1). All wells were surveyed at the top and bottom of the well casing using a Tremble unit (5700 L1 GPS). Two EEI (Electronic Engineering Innovations Model 2.0) pressure transducers were employed at the Hispanic Culture Center (HCC) site and three Solinst Levelogger (Model 3001) pressure transducers were employed at the South Valley (SHK) site. All instruments were programmed to take groundwater depths every 30 minutes. Groundwater models for both sites were created using ArcGIS 9 and ArcScene software. HCC models were performed January 14, March 7, July 28, September 12 and October 12 for the year 2004. SHK models were performed on January 14, April 11, July 28, and August 24 for the year 2004. Rio Grande discharge data is from the USGS website (Rio Grande at Albuquerque gage 08330000). Figure 2 Figure 5 Figure 4 Figure 6 Figure 3 Hispanic Cultural Center (HCC) groundwater models South Valley (SHK) groundwater models a b January – purple July – red September - green October - blue January – purple April – orange July - red August - green River Flow Levee Figure 8 River Flow Levee Figure 7 Figure 9


