Download
1 / 32
330 likes | 481 Views
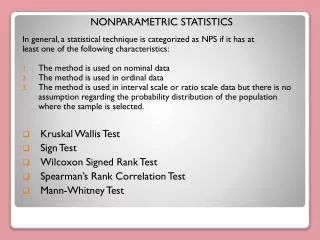
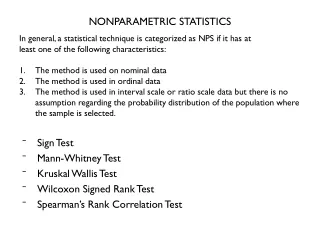
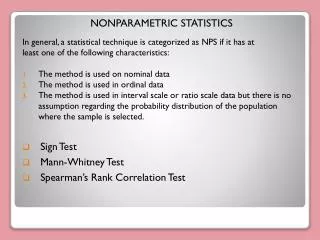
NONPARAMETRIC STATISTICS In general, a statistical technique is categorized as NPS if it has at least one of the following characteristics: The method is used on nominal data The method is used in ordinal data

E N D
NONPARAMETRIC STATISTICS In general, a statistical technique is categorized as NPS if it has at least one of the following characteristics: • The method is used on nominal data • The method is used in ordinal data • The method is used in interval scale or ratio scale data but there is no assumption regarding the probability distribution of the population where the sample is selected. • Sign Test • Mann-Whitney Test • Spearman’s Rank Correlation Test
Nonparametric versus Parametric Statistics • Parametric statistical procedures are inferential procedures that rely on testing claims regarding parameters such as In some circumstances, the use of parametric procedures required some certain assumptions that need to be satisfied such as check for the normality distribution. • Nonparametric statistical procedures are inferential procedures that are not based on parameters and required fewer assumptions that need to satisfy to perform tests. They do not required the population to follow a specific type of distribution or in other words known as distribution free procedures. • Inferences : Parametric makes inference regarding the mean. Nonparametric makes inference regarding the median.
Advantages of Nonparametric • Most of the tests required very few assumptions. • The computation is fairly easy. • The procedures can be used for count data or rank data. Disadvantages of NonParametric • Because of there are fewer requirements that must be satisfied to conduct these tests, researches sometimes use these procedures when parametric procedures can be used. • Less efficient than parametric procedures. Required a larger sample size for nonparametric procedure.
Sign Test • The sign test is used to test the null hypothesis and whether or not two groups are equally sized. • In other word, to test of the population proportion for testing in a small sample (usually ) • It based on the direction of the + and – sign of the observation and not their numerical magnitude. • It also called the binomial sign test with the null proportion is 0.5 (Uses the binomial distribution as the decision rule). A binomial experiment consist of nidentical trial with probability of success, pin each trial. The probability of x success in n trials is given by
There are two types of sign test : 1. One sample sign test 2. Paired sample sign test Hypothesis Testing:
One Sample Sign Test Procedure: • Put a + sign for a value greater than the median value Put a - sign for a value less than the median value Put a 0 as the value equal to the median value • Calculate: • The number of + sign, denoted by x • The number of sample, denoted by n (discard/ignore the data with value 0) 3. Run the test i. State the null and alternative hypothesis • Determine level of significance, • Reject • Determining the p – value for the test for n, x and p = 0.5, from binomial probability table base on the type of test being conducted
Example 5.1: The following data constitute a random sample of 15 measurement of the octane rating of a certain kind gasoline: 99.0 102.3 99.8 100.5 99.7 96.2 99.1 102.5 103.3 97.4 100.4 98.9 98.3 98.0 101.6 Test the null hypothesis against the alternative hypothesis at the 0.01 level of significance. Solution: 99.0 102.3 99.8 100.5 99.7 96.2 99.1 102.5 103.3 97.4 100.4 + + + + + - + + + - + 98.9 98.3 98.0 101.6 + + 0 + Number of + sign, x = 12 Number of sample, n = 14 (15 -1) p = 0.5
1. 2. 3. From binomial probability table for x = 12, n = 14 and p = 0.5 4. Since and conclude that the median octane rating of the given kind of gasoline exceeds 98.0
Example 5.2 A recent article in the school newspaper reported that the typical credit card debt of a student is $500. A researcher claims that the median credit card debts of students is different from $500. To test this claim, he obtain a random sample of 20 students enrolled at the college and asks them to disclose their credit-card debt. The results are as below. Test at 5% significance level.
Solution: 1. 2. 3. From binomial probability table for x = 8, n = 20 and p = 0.5,
4. p-value = 0.5034 >0.05, Do not reject 5. There is not sufficient evidence to support the researcher claim that the median credit-card debt of students is different from $500.
Exercise 5.2 The PQR Company claims that the lifetime of a type of battery that is manufactures is different from 250 hours. A consumer advocate wishing to determine whether the claim is justified measures the lifetime of 24 of the company batteries, the results are listed below. Determine whether the company claim is justified at 5% significance level. 271 230 198 275 282 225 284 219 253 216 262 288 236 291 253 224 264 295 211 252 Ans: Do not reject
Paired Sample Sign Test Procedure: • Calculate the difference, and record the sign of • i. Calculate the number of + sign and denoted as x ii. The number of sample, denoted by n (discard/ignore data with value 0) * probability is 0.5 (p = 0.5) • Run the test i. State the null hypothesis and alternative hypothesis ii. Determine the level of significance iii. Reject iv. Determining the p value for the test for n, x and p = 0.5 from binomial probability table base on type of test being conducted. v. Make decision
Example 5.3: 10 engineering students went on a diet program in an attempt to loose weight with the following results: Is the diet program an effective means of losing weight? Do the test at significance level
Solution: Let the sign + indicates weight before – weight after > 0 and – indicates weight before – weight after < 0 Thus
1. The + sign indicates the diet program is effective in reducing weight 2. . So we reject 3. Number of + sign, Number of sample, 4. Since . So we can reject and we can conclude that there is sufficient evidence that the diet program is an effective programme to reduce weight.
Exercise 5.2: 8 panels of wood are painted with one side of each panel with paint containing the new additive and the other side with paint containing the regular additive. The drying time, in hours, were recorded as follows: Use the sign test at the 0.05 level to test the hypothesis that the new additive have the same drying time as the regular additive. Ans: Do not reject
Mann-Whitney Test • Mann-Whitney Test is a nonparametric procedure that is used to test the equality of two population medians from the independent samples. • To determine whether a difference exist between two populations • Sometimes called as Wilcoxon rank sum test
Example 5.4: Data below show the marks obtained by electrical engineering students in an examination: Can we conclude the achievements of male and female students identical at significance level
Solution: 1. 2. Test Statistic: 1. 2.
From the table of Mann Whitney test for Reject Since , thus we fail to reject and conclude that the achievements of male and female are not significantly different.
Exercise 5.3: Using high school records, Johnson High school administrators selected a random sample of four high school students who attended Garfield Junior High and another random sample of five students who attended Mulbery Junior High. The ordinal class standings for the nine students are listed in the table below. Test using Mann-Whitney test at 0.05 level of significance whether the Garfield Junior High is the same with Mulbery Junior High.
Rank Spearman • A nonparametric procedure regarding the relationship of variables (X and Y). • The procedure in Spearman Rank is have to rank the data before calculate the Spearman Rank.
Example 5.5: The data below show the effect of the mole ratio of sebacic acid on the intrinsic viscosity of copolyesters. Find the Spearman rank correlation coefficient to measure the relationship of mole ratio of sebacic acid and the viscosity of copolyesters. Solutions: X: mole ratio of sebacic Y: viscosity of copolyesters
Thus which shows a weak negative correlation between the mole ratio of sebacic acid and the viscosity of copolyesters
Exercise 5.4: The following data were collected and rank during an experiment to determine the change in thrust efficiency, y as the divergence angle of a rocket nozzle, x changes: Find the Spearman rank correlation coefficient to measure the relationship between the divergence angle of a rocket nozzle and the change in thrust efficiency.
Exercise 5.5 Suppose eight elementary school science teachers have been ranked by a judge according to their teaching ability and all have taken a “national teachers’ examination.” Calculate the Spearman rank correlation coefficient to measure the relationship between Judge Rank ( ) and Test Rank ( ).