Download
1 / 9
90 likes | 105 Views
Additional information gathered by the astrophysics team of the USS Drongo regarding the strange moon, including radar reflections, optical and infrared emissions, and pictures.

E N D
ASTR1001 Assigment 1: Supplementary Data Release. More information for the science team of the USS Drongo
More Information • In response to popular demand, here is some more information gleaned by the astrophysics team of the USS Drongo. • You may or may not find this extra information valuable! • You don’t need to use this additional information to get a decent mark - but if you want an extremely high mark, you should make what use you can of this new information.
Communications and Scanners Division • The Communications and Scanners division were excited by your report of the strange, bright featureless moon, so they turned their equipment on it, before it set. • Here is what they found.
Radar • They used the USS Drongo’s powerful main radio communications array to beam an intense pulse of radio emission at the “moon”. • A reflection of this pulse was detected, 4.56 seconds after the original pulse was sent.
Spectrum • Next, they turned their spectral scanners onto the moon. • This was done just before it set. At this point, the lower half of the “moon” was bright, while the top half was dark.
Bright Half • Here is the spectrum of the bright (illuminated) half, at optical wavelengths. • This is a plot of energy per unit wavelength (y-axis) against wavelength (x-axis) An Angstrom is 0.1 nano-metres
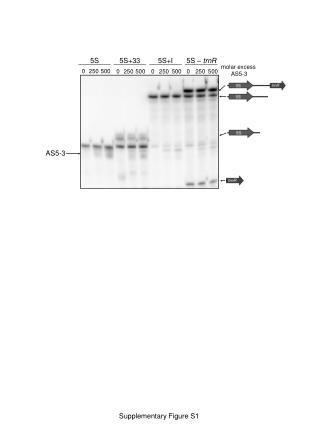
Night Side • No optical emission was detected from the dark side of the “moon”. • However, strong emission was detected at near infra-red wavelengths, shown here. • Furthermore, this emission varied with time - the green and red lines show different spectra taken four hours apart.
IR Bumps • Clearly most of the IR emission from the dark side comes out at particular wavelengths, forming bumps in the spectrum. • One of the scanners was tuned to look only at emission at the wavelength of one of these bumps: the one at a wavelength of 2.3 microns (micro-metres). • It was then pointed at the “moon”
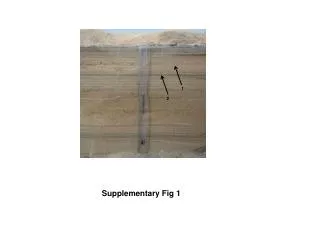
Pictures of the Moon. Here are four pictures of the emission at this wavelength. They were taken at four hour intervals, just before it set. The order is indicated by the numbers. The bottom right of each image is masked off to avoid the scanned being swamped by emission from the bright side of the “moon”. 1 2 4 3