Download
1 / 17
170 likes | 310 Views
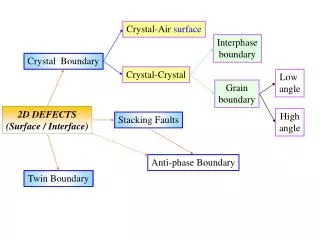
TES and Surface Measurements for Air Quality. Brad Pierce 1 , Jay Al-Saadi 2 , Jim Szykman 3 , Todd Schaack 4 , Kevin Bowman 5 , P.K. Bhartia 6 , Anne Thompson 7 NOAA NESDIS NASA Langley Research Center US Environmental Protection Agency University of Wisconsin/SSEC NASA JPL NASA GSFC

E N D
TES and Surface Measurements for Air Quality Brad Pierce1, Jay Al-Saadi2, Jim Szykman3, Todd Schaack4, Kevin Bowman5, P.K. Bhartia6, Anne Thompson7 NOAA NESDIS NASA Langley Research Center US Environmental Protection Agency University of Wisconsin/SSEC NASA JPL NASA GSFC Penn State University Presented by Jay Al-Saadi
RAQMS Trop O3 Column vs OMI: Impact of TES O3 Assimilation CONUS comparison: Left, OMI assimilation only; Right, OMI with TES Over CONUS, adding TES assimilation changes mean column bias from +3.6 to -1.3 DU with little change in correlation (0.90 vs 0.87)
Comparison of RAQMS NRT OMI analysis with IONS ozonesondes (373 sondes, August, 2006) PI: ANNE M. THOMPSON Penn State RAQMS NRT OMI Tropospheric Ozone Column (August 01-31, 2006) Large high bias (50-100%) in upper troposphere/lower stratosphere
Comparison of RAQMS OMI+TES reanalysis with IONS ozonesondes (373 sondes, August, 2006) PI: ANNE M. THOMPSON Penn State RAQMS OMI+TES Tropospheric Ozone Column (August 01-31, 2006) Significant reduction in upper troposphere/ lower stratosphere biases; Small changes in lower trop biases Note: Change in Scale!
RAQMS August, 2006 Mean OMI O3 and TES O3 Analysis Increments (total column)(Note scale change!) TES Increment OMI Increment Assimilation of OMI total column O3 measurements results in small (1-1.5%) mean increases in total column O3 over CONUS. Assimilation of TES O3 profiles results in moderate (+/- 10%) adjustments in total O3 column over CONUS. In some locations, anti-correlation between OMI and TES increments (e.g., Southwest).
RAQMS August, 2006 Mean TES O3 Analysis Increments (troposphere and PBL column) TES Tropospheric Increment TES PBL Increment Assimilation of TES O3 profiles results in moderate (+/- 10%) adjustments in tropospheric O3 column over CONUS. Assimilation of TES O3 profiles results in larger adjustments in PBL O3 column. Largest positive adjustments (+20%) occur within the Southern CA, coastal Gulf, and Great Lakes regions. Largest negative adjustments (-15%) occur within the central Rockies and Ohio River Valley.
RAQMS vs EPA AIRNow July 15-Oct 15, 2006 RAQMS diurnally averaged surface O3 analyses are reasonably correlated (>0.7) with EPA AIRNow observations over the eastern US but show 18Z median biases of up to 30ppbv over the eastern US
RAQMS Trop O3 vs OMI (cloud-cleared) RAQMS O3 vs NOAA P3 RAQMS mean trop O3 column is low by a factor of up to 20% relative to OMI-RAQMSstrat over TX RAQMS median O3 profile is high by 20ppbv relative to P3 measurements
TEXAQS 2006 Ensemble Lagrangian Trajectory Analysis • Ensemble 18Z Back trajectories are initialized daily at locations of Houston and Dallas, TX EPA AIRNow surface ozone monitoring stations. • Trajectories sample forecasted chemical fields to understand transformation during transport. • Lagrangian averaged ensemble O3 Production-Loss (P-L) is used to classify back trajectories Back trajectory Chemistry 2006090418 NOy Emissions SFC (red) and 850 (blue) 5-day Houstonback trajectories 2006090418 O3 P-L
RAQMSglobal back-trajectory analysis of regional (or “background”) influences on Houston 18Z Ozone July 15-October 15, 2006 Classification based on ensemble mean 5-day Lagrangian averaged O3 net production Enhanced O3 production (P-L > 10 ppbv/day) Moderate O3 production (0 < P-L < 10 ppbv/day) Net O3 destruction (O3 P-L < 0 ppbv/day) Red=Observed AIRNow MSA mean & variability Solid=RAQMS AIRNow MSA mean (bias corrected) Dash=RAQMS background mean (bias corrected)[immediately prior to entering Houston MSA] • Houston experienced enhanced regional O3 production 16% of days during the study • Enhanced regional O3 production events preceded 3 out of 6 periods with elevated O3
Source Apportionment for O3 net production > 10 ppbv/day Binning the NOy sources and O3 mixing ratios along the trajectories results in source apportionment maps for each class Apportioned O3 Apportioned NOx Emissions O3 P-L (ppbv/day) NOy emissions (ppbv/day) Enhanced background O3 production is associated with NOx sources from the central Midwest/Ohio River Valley with significant O3 P-L (more than 30ppbv/day) on average over the study period.
RAQMS O3 vs NOAA P3 insitu: Impact of TES O3 Assimilation TexAQS comparison: Left, OMI assimilation only; Right, OMI with TES In TexAQS domain, adding TES assimilation reduces high bias and variance in upper troposphere but increases bias near the surface. Overall, better agreement with observed profile shape but high biased.
RAQMS August, 2006 Mean TES CO Analysis Increments (troposphere and PBL column) TES Tropospheric Increment TES PBL Increment Assimilation of TES CO profiles results in moderate (+/- 5%) adjustments in tropospheric CO column (left) over CONUS. Largest (+10%) positive PBL column adjustments (right) occur over central Texas.
RAQMS vs EPA AIRNow July 15-Oct 15, 2006 RAQMS diurnally averaged surface O3 analyses are reasonably correlated (>0.7) with EPA AIRNow observations over the eastern US but show 18Z median biases of up to 30ppbv over the eastern US
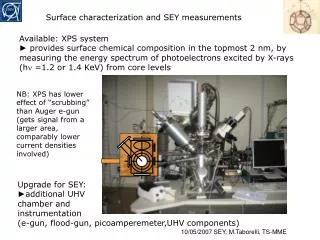
TES Limb View Nadir View TES is an Infared Fourier transform spectrometer specifically designed to measure tropospheric ozone and its precursors • Estimates vertical profiles from the surface to .01 mb • of temperature, H2O,ozone, carbon monoxide, HNO3 • as well as emissivity, surface temperature, • and effective cloud parameters • 0.5 x 5 km (nadir) spatial resolution
Here are the constraints on the TES assimilation.TES Global Survey Nadir ObservationsTES O31. only assimilate between 60s - 60n2. only assimilate 10mb and below3. only assimilate if first guess or observation do not exceed 1e-64. using TES O3 quality control flagTES CO1. only assimilate between 60s-60n2. only assimilate below the tropopause3. using TES CO quality control flag.