Download
1 / 38
380 likes | 537 Views
Geostatistics Revisited: Patterns in the United States. David R. Maidment 6 November 2008. Election as Geostatistics : Location matters!!. Statistical sampling of voters. Final Preelection Polls. Election on (11/4/08). Election “Population”. Population size: 125,225,901

E N D
Geostatistics Revisited:Patterns in the United States David R. Maidment 6 November 2008
Statistical sampling of voters Final Preelection Polls Election on (11/4/08)
Election “Population” Population size: 125,225,901 Spread – Obama: 53% to McCain: 46%
Election “Sample”(Stratified Random Sampling) National Survey of 1,000 Likely Voters Sample size: 1000 Spread – Obama: 52% to McCain: 46% Sample: Population = 1000 : 120 million or 0.00083%
Air Temperature: “Population” Nebraska
Random Fields:Probabilistic processes in space Voters: A finite population of spatially discrete objects Air Temperature: An infinite population which forms a spatial continuum
Air Temperature on an X-Y plane Northing, Y Easting, X
Temperature and Elevation Contrary trend to normal, where temperature decreases with elevation
Histogram of Air Temperature Degrees Centigrade * 10-1
Normal Q-Q Plot Degrees Centigrade * 10-1 Standard Normal Variate, z
Normal Q-Q Plot Plotting posn = (i-0.5)/n, i=1 is lowest value and i= n is highest value x z
Semivariogram Dist = 4.75 x 10⁵m
Trend removal Semivariogram with no trend removal Semivariogram with linear trend removal Long memory data Short memory data
Mean, Standard Deviation and Standard Error of Estimate Air Temperature data in Nebraska (215 sites) Mean = 6.96 °C Standard Deviation = 2.07 °C Standard Error of Mean = 0.47 °C
Estimating Water Use in the United States http://www.nap.edu/catalog.php?record_id=10484
National Water Use Estimation All variables defined for state i in year t TW = total water use PS = public water supply DM = domestic use CM = commercial use IR = irrigation use LS = livestock use IN = industrial use MN = mining use TE = thermoelectric use
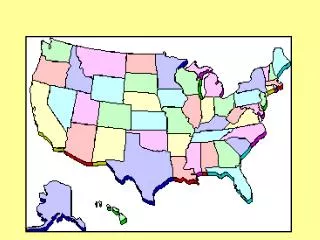
Category 1 (10 states) Arkansas, Delaware, Hawaii, Indiana, Kansas, Louisiana, Massachusetts, New Jersey, New Hampshire, Vermont Category 2 (12 states) Alabama, Illinois, Maryland, Minnesota, Mississippi, New Mexico, North Dakota, Ohio, Oklahoma, Oregon, Utah, Virginia Category 3 (28 states + PR) Alaska, Arizona, California, Colorado, Connecticut, Florida, Georgia, Idaho, Iowa, Kentucky, Maine, Michigan, Missouri, Montana, Nebraska, Nevada, New York, North Carolina, Pennsylvania, Puerto Rico, Rhode Island, South Carolina, South Dakota, Tennessee, Texas, Washington, West Virginia, Wisconsin, Wyoming State Water Use Databases - Survey undertaken with the assistance of USGS water use specialists Category 1 2 3
Direct Estimation: sample n and extrapolate to population of size N Indirect Estimation: use regression or a water use coefficient model to get water use in each state Water Use Estimation
Trends in Water Use in the US Solley et al., 1998
Nuclear power plant in Pope County (1/12 of all water use in the State) Total Water Use
Arkansas Site-Specific Water-Use Database ~50,000 points with monthly water withdrawal estimates
Surface and Groundwater Points Surface water: 5,600 points Groundwater: 39,100 points Data are reported to AWSCC in acre-ft per month or year Data are reported to USGSnational summary in MGD
Ozark Plateaus Edwards-Trinity Mississippi River Valley Alluvium Mississippi Embayment Arkansas Aquifers
Withdrawals from the Mississippi Alluvium 33,700 wells (86%) out of 39,100 total draw from the Mississippi Alluvium
VT = variance of total water use Nh = total number of sites in stratum h, nh = sampled sites in stratum h, n = total number of samples and sh2 = variance of water use at a site in stratum h Stratified Random Sampling sL2 h=L Domestic Comm. Industrial s22 h=2 Irrigation s12 PWS h=1
Random sampling: Number of Samples RequiredArkansas, irrigation from groundwater Total use = 5,492,730 MG Desired standard error = 549,273 MG requires 111 samples
A Sampling Scheme(for 10% standard error in total water use) nh Nh n = Power uses have complete inventory, others are randomly sampled
Summary of Recommendations • Elevate the NWUIP to a water-use science program, emphasizing statistical estimation of water use and the determinants and impacts of water use. • Systematically compare water-use estimation methods to identify the techniques best suited to the requirements and limitations of the NWUIP. Determine the standard error for every water-use estimate. • (Move from an inventory model to a statistical model to produce national estimates.)
Summary of Recommendations • Systematically integrate datasets, including those maintained by other federal and state agencies, into datasets already maintained by the NWUIP. • Focus on the scientific integration of water use, water flow, and water quality to expand knowledge and generate policy-relevant information about human impacts on both water and ecological resources • Seek support from Congress for dedicated funding of a national component water-use science program to supplement the existing funding in the Coop Program This is now funded and is called the “Water for America” program