
Ecology
E N D
Presentation Transcript
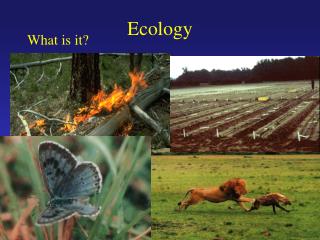
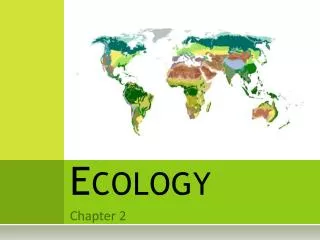
WHAT IS ECOLOGY? Ecology-the scientific study of interactions between organisms and their environments, focusing on energy transfer Ecology is a science of relationships https://www.youtube.com/watch?v=GlnFylwdYH4
WHAT DO YOU MEAN BY ENVIRONMENT? The environment is made up of two factors: • Biotic factors- all living organisms inhabiting the Earth • Abiotic factors- nonliving parts of the environment (i.e. temperature, soil, light, moisture, air currents)
Whale Clock Water Fish Paper Glass Aluminum Wooden Ruler Sand Clouds Corpse Snail Steak Pork Chops Salad Bread Plant Hair Finger Nails Metal Cotton Fabric Wool Gold Plastic Grapes Air Part 1: Organisms and their Relationships Biotic or Abiotic?
Biosphere Ecosystem Community Population Organism
Organism -any unicellular or multicellular form exhibiting all of the characteristics of life, an individual.
POPULATION • a group of organisms of one species living in the same place at the same time that interbreed • Produce fertile offspring • Compete with each other for resources (food, mates, shelter, etc.)
Community -several interacting populations that inhabit a common environment and are interdependent.
Ecosystem -populations in a community and the abiotic factors with which they interact (ex. marine, terrestrial)
Biosphere - life supporting portions of Earth composed of air, land, fresh water, and salt water.
Niche -the role a species plays in a community; its total way of life Habitat- the place in which an organism lives out its life Habitat vs. Niche
Habitat: the actual place an organism lives Niche: both living and non-living parts of an ecosystem that determines an organism’s role in the ecosystem. If two species share the same niche, they will have various interactions. How can species interact? An organism’s niche
These relationships are complex. Each population of species interacts with other species, or biotic factors, as well as with the all of the abiotic factors. • The niche of an organism and it’s interactions is determined by where it stands in the ecological structure of the ecosystem. -Producers -Consumers -Decomposers -Scavengers
Part 1: Organisms and their Relationships Habitat vs. Niche “The ecological niche of an organism depends not only on where it lives but also on what it does. “By analogy, it may be said that the habitat is the organism's ‘address’, and the niche is its ‘profession’, biologically speaking.” of Ecology
Predator/Prey: One organism (predator) will actively hunt and consume another (prey). Competition: two or more organisms of same or different species compete to use the same limited resources or basic needs Relationships in the ecosystem
Parasitism: an organism (parasite) lives in or on another (host) and feeds on it without immediately killing it Mutualism: a cooperative partnership between two species (both benefit) Commensalism: a relationship where one species benefits and the other remains unaffected Symbiotic Relationships
Symbiotic Relationships Commensalism Ex. orchids on a tree Epiphytes: A plant, such as a tropical orchid or a bromeliad, that grows on another plant upon which it depends for mechanical support but not for nutrients. Also called xerophyte, air plant.
Symbiotic Relationships Commensalism Ex. polar bears and cyanobacteria
Symbiotic Relationships Parasitise Ex. lampreys, leeches, fleas, ticks, tapeworm
Symbiotic Relationships Mutualism Ex. cleaning birds and cleaner shrimp
Symbiotic Relationships Mutualism Ex. Lichen is a bacteria and a fungi
Feeding Relationships Tropisms and levels
Producers are autotrophic organisms that make their own food. • Phototrophic organisms use photosynthesis and contain chlorophyll (Carbon Dioxide + Water + Sunlight =Sugar + Oxygen) • Chemotrophic organisms use chemicals other than H20, such as H2S Producers
Consumers are heterotrophic organisms that cannot make their own food. They must ingest (eat) other organisms. -Herbivores feed on vegetation (producers). -Carnivores feed on herbivores or on other carnivores. • Secondary carnivoresfeed on herbivores, • Tertiary consumersfeed on other carnivores -Omnivores feed on both producers and consumers -Scavengers feed on dead or decaying organisms Consumers
Scavengers feed on CARRION (dead or injured animal corpses) and dead plant biomass. Scavengers reduce the size of dead organic matter…Decomposers will finish the job!
DECOMPOSERS are heterotrophs that recycle small, often microscopic bits of dead organic matter into inorganic nutrients availbe for plants to take up from the soil. Decomposers RECYCLE nutrients! BACTERIA and FUNGI are decomposers…most worms are plant scavengers!
Part 2: Flow of Energy in an Ecosystem Models of Energy Flow • Trophic Levels: Each step in a food chain or food web. • Autotrophs always make up the first trophic level in ecosystems. • Heterotrophs make up the remaining levels
Energy in the Ecosystem • Energy from the sun enters and ecosystem when producers used the energy to make organic matter through photosynthesis. • Glucose is the primary energy source (carbohydrate) produced by photosynthesis. • Consumers take in this energy when they eat producers or other consumers.
Energy in the Ecosystem • Plants absorb less than 1% of the sunlight that reaches them! • However, photosynthetic organisms make 170 billion metric tons of food each year! • The energy captured by producers is used to make cells in both producers and consumers.
Trophic levels are the different feeding levels of organisms in an ecosystem. Producers are the first trophic level and consumers make up several more. These relationships can be seen in an ecological pyramid. Biomass: the total amount of organic matter present in a trophic level. The biomass in each trophic level is the amount of energy- in the form of food- available to the next trophic level. Trophic levels
The Ten Percent Law • Most of the energy that enters through organisms in a trophic level does not become biomass. Only energy used to make biomass remains available to the next level. • When all of the energy losses are added together, only about 10% of the energy entering one trophic level forms biomass in the next trophic level. This is known as the 10 percent law.
MORE Ten Percent Law • The 10 percent law is the main reason that most food chains have five or less links. Because 90 percent of the food chain’s energy is lost at each level, the amount of available energy decreases quickly. 10 PERCENT LAW!!
ENERGY FLOW Heat and Movement Consumed Digested 10% Out Growth Waste Not Digested Not Consumed Decomposers 100% In The majority of energy is lost via heat and movement!
10% Rule • As a rule, only 10% of the energy from one level gets passed on to the next level. • Sun-100% solar energy • Autotrophs- 10% of original energy is passed • Herbivores- 1% of original energy is passed • Carnivores- 0.1% of original energy is passed
Ecological pyramid Remember scavengers and decomposers can enter at any level! Tertiary Consumers= CARNIVORE EATING OTHER CARNIVORES Secondary Consumers= CARNIVORES EATING HERBIVORES Primary Consumers= HERBIVORES PRODUCERS = Autotrophic Plants
Ecological Pyramids • Relative amounts of energy are represented in an ecological pyramid:a diagram that shows the relative amounts of energy in different trophic levels in an ecosystem. An ecological pyramid can show energy, biomass, or the number of organisms in a food web.
Ecological Pyramid: Energy Shows the relative transfer of energy (joules) from one trophic level to the next.
Ecological Pyramid: Biomass Shows the relative amounts of organic matter (gram) from one trophic level to the next.
Ecological Pyramid: Number of Organisms Shows the relative number of organisms at each trophic level.
Food Chains A Food CHAIN is a series of organisms that transfer food between the trophic levels of an ecosystem using only one species at each level…a simple chain. • The arrows represent the flow of energy from one organism to the next. • The arrow points toward the organism doing the ‘eating’.
Food Webs Ecosystems are not as simple as shown and not often explained by a single food chain…Food WEBS more accurately show the network of food chains representing the feeding relationships among organisms in an ecosystem. • Most organisms feed on more than one type of organism at different trophic levels.
How do Food Webs show complexity? • The diversity and stability of an ecosystem is represented by more complex webs that have many species and many interactions (lots of arrows) because they are more stable…more resistant to disturbance by natural disaster or human interference. Why?
Biological Magnification • BIOLOGICAL MAGNIFICATION • The concentration of a pollutant in organisms increases at higher trophic levels in the food web because these chemicals build-up in the fatty tissues of these organism and do not dissolve or flush-out of the organism. • DDT & Mercury examples: • DDT is a pesticide used to kill insects like malaria-carrying mosquitoes. However, this chemical will magnify in concentration in larger organisms like birds and mammals and harm their reproductive abilities. • Bald eagle populations declined rapidly to the point of extinction as an endangered species as mother birds were not able to incubate or hatch their eggs because the eggs shells were too thin and would crush and break when sat upon to keep warm in the nest.
Biological Magnification As the living organisms eats more, the concentration of these substances increases as they pass from one trophic level to the next.
The day it Rained cats… • A bizarre case of ecological damage from DDT occurred in Borneo after the World Health Organization sprayed huge amounts of the pesticide. The area's geckos, or lizards, feasted on the houseflies that had been killed by DDT. The geckos, in turn, were devoured by local cats. Unhappily, the cats perished in such large numbers from DDT poisoning that the rats they once kept in check began overrunning whole villages. Alarmed by the threat of plague, WHO officials were forced to replenish Borneo's supply of cats by parachute.