Download
1 / 35
350 likes | 371 Views
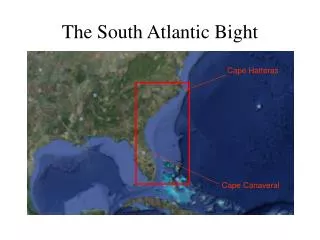
Explore invertebrate response models in urban areas of Atlanta, Birmingham, and Raleigh to predict water quality patterns. Study the applicability of these models across the Southeast. Evaluate the interchangeability of ordination and regression models and consider extrapolation to the South Atlantic Gulf and Tennessee River basins.

E N D
North Carolina Water Science Center Biologically based urban response models for the South Atlantic gulf and Tennessee River basins T.F. Cuffney, E.M. Giddings, and M.B. Gregory
Objectives: • Derive invertebrate response models for Atlanta, GA, Birmingham, AL, and Raleigh, NC. • Test and verify urban response models (ATL, BIR, RAL). • Comparability among models • Applicability of urban models to sites throughout the Southeast – can models developed in one urban area be applied to other urban areas? – can urban models be used to predict regional patterns in water-quality?
National Water-Quality Assessment (NAWQA) Program 11 Urban Stream Studies Seattle Portland Boston Milwaukee Salt Lake City Sacramento Denver Raleigh Atlanta Birmingham Dallas South Atlantic gulf and Tennessee river basins
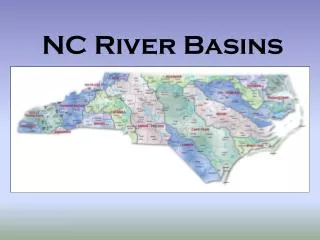
Biological sampling sites Raleigh Birmingham Atlanta 0 90 360 180 Kilometers
Raleigh Urban Study Area Piedmont
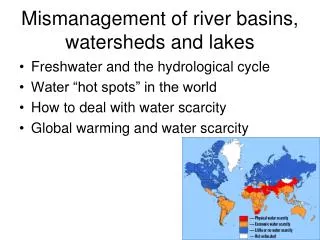
Design of urban studies • Urban intensity gradient defined by amultimetric index based on land-cover, population, infrastructure and socioeconomic factors associated with population density. • Uniform environmental setting to keep natural environmental factors as constant as possible.
Urban models • Multivariate (ordination) models: • Measure ecological distances among sites along an environmental gradient (urban) derived from differences in invertebrate assemblages. • Multiple regression models: • Relate invertebrate assemblage metrics (EPT) to landscape variables: land cover, land use, census variables, infrastructure.
Ordinations scores & UII Atlanta
RTH Inverts: urban model 10% impervious surface
Ordination site scores vs. UII Y = a + bX Y = ordination site score X = urban intensity UII
Ordination model: prediction Predicting ATL using BIR model ATL Site score Eigenvalue from BIR model Species abundance from ATL. Optima for species K: BIR model
Woody snags Piedmont Piedmont Ridge & Valley Riffles Observed Axis 1 site score
Inter-model comparisons: ordination models • Ordination models from Atlanta, Birmingham, and Raleigh are interchangeable. • Ordination models developed in one urban area can be applied to other closely allied urban areas.
Regression models Comparison among ATL, BIR, RAL
Multiple Regression Models • EPTr: richness of pollution intolerant forms (mayflies, stoneflies, caddisflies) • Xi: • Land-use: (e.g., forest, developed, ag/urban grass) • % basin area • % stream buffer • Population density • Road density Model: EPTr = f(Xi)
Correspondence between predicted and observed EPT richness based on multiple regression models Expected = a + b * Observed
Predicted EPT richness based on multiple regression models Expected = a + b * Observed
Inter-model comparisons: multiple regression models • Variability associated with estimating explanatory variables reduces the overall “fit” of the regression models. • Multiple regression models are not as interchangeable among urban study areas as are the ordination models.
Extrapolating urban models to South Atlantic gulf and Tennessee (SAGT) River basins Can urban models be used to predict regional patterns in water-quality?
Ordination models Observed vs. expected site scores
Interior Plateau: Ordination UII: 3-32 Sites: 35 MODEL:
Southeastern Plains: Ordination UII: 4-81 Sites: 48
Multiple regression models Observed vs. expected EPT richness
EPT: multiple regression model UII: 3-32 Sites: 35
EPT: multiple regression model UII: 4-81 Sites: 48
Tolerances to urbanization differ from tolerances to general pollution Species tolerances Urban pollution tolerance values: NAWQA (UII) General pollution tolerance values: USEPA and NCDENR
Conclusions • Invertebrate responses to urbanization provide very useful predictive models. • Ordination models were generally better predictors of responses than were multiple regression models using metrics. • Urban models based on ordination were transferable among urban areas -- models developed for one urban area are applicable to other urban areas. • Urban models are specific to urbanization and do not provide a general means of modeling regional responses to water quality – network design affects application.
Next steps • Derive more generalized land-use disturbance models (forest, agriculture, urban). • Couple biological response models with SPARROW modeling in South Atlantic gulf and Tennessee River basins.