Download
1 / 32
320 likes | 322 Views
The global nucleic acid isolation and purification market was estimated at $2,304.7 Million in 2020 and is expected to grow at a CAGR of 7.20% from 2021 to 2031.<br>

E N D
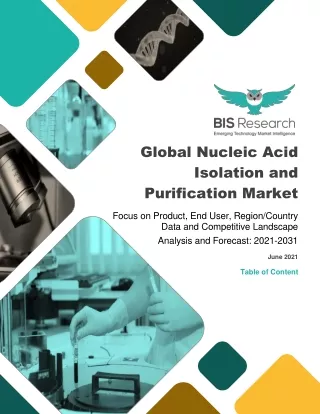
Global Nucleic Acid Isolation and Purification Market Focus on Product, End User, Region/Country Data and Competitive Landscape Analysis and Forecast: 2021-2031 June 2021 Table of Content
Global Nucleic Acid Isolation and Purification Market BIS Research is a leading market intelligence and technology research company. BIS Research publishes in-depth market intelligence reports focusing on the market estimations, technology analysis, emerging high-growth applications, deeply segmented granular country-level market data and other important market parameters useful in the strategic decision making for senior management. BIS Research provides multi-client reports, company profiles, databases, and custom research services. Copyright © 2021 BIS Research Inc. All Rights Reserved. This document contains highly confidential information and is the sole property of BIS Research. Disclosing, copying, circulating, quoting or otherwise reproducing any or all contents of this document is strictly prohibited. Access to this information is provided exclusively for the benefit of the people or organization concerned. It may not be accessed by or offered whether for sale or otherwise to any third party. All rights reserved at BIS Research 2
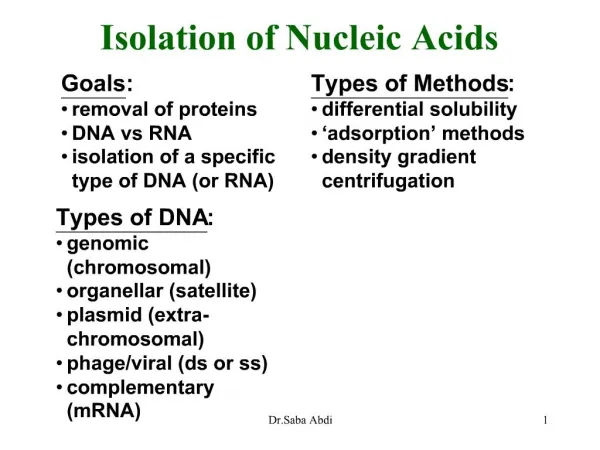
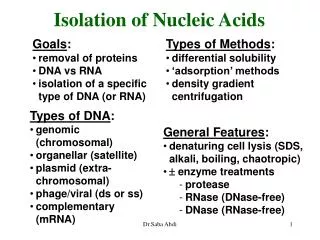
Global Nucleic Acid Isolation and Purification Market T Table of able of C Contents ontents 1. Product Definition .............................................................................................. 41 1.1 Inclusion and Exclusion .............................................................................. 41 2. Research Scope .................................................................................................. 42 2.1 Scope of the Study ....................................................................................... 42 3. Research Methodology ...................................................................................... 43 3.1 Global Nucleic Acid Isolation and Purification Market: Research Methodology ................................................................................................. 43 Primary Data Sources .................................................................................. 44 Secondary Data Sources ............................................................................. 45 Market Estimation Model ............................................................................. 45 3.2 3.3 3.4 4. Market Overview ................................................................................................. 49 4.1 Definitions ..................................................................................................... 49 4.1.1 Product Definition ............................................................................. 49 4.1.2 Definition by Products ...................................................................... 49 4.1.2.1 Instruments .......................................................................................... 49 4.1.2.2 Column-Based Instruments ................................................................. 49 4.1.2.3 Bead-Based Instruments ..................................................................... 50 4.1.2.4 Low-Throughput Instruments ............................................................... 50 4.1.2.5 Medium-Throughput Instruments ........................................................ 50 4.1.2.6 High-Throughput Instruments .............................................................. 50 4.1.2.7 Kits ...................................................................................................... 51 4.1.2.8 Reagents ............................................................................................. 51 4.2 Nucleic Acid Isolation and Purification Automation Applications ........... 51 4.2.1 Genomic/Plasmid DNA Extraction ................................................... 52 4.2.2 Cell-Free DNA (cfDNA) Extraction .................................................... 52 4.2.3 Viral RNA Extraction ......................................................................... 52 4.2.4 Cell-Free RNA Extraction .................................................................. 53 4.3 Market Size and Growth Potential, $Million, 2020-2031 ............................ 53 4.3.1 North America .................................................................................... 53 All rights reserved at BIS Research 3
Global Nucleic Acid Isolation and Purification Market Europe, Middle East & Africa (EMEA) .............................................. 54 Asia-Pacific (APAC) ........................................................................... 56 Latin America ..................................................................................... 57 Market Attractiveness: Macro and Micro Factor Analysis ........................ 58 Impact of COVID-19 Pandemic on Nucleic Acid Isolation and Purification Market ....................................................................................... 58 Market Dynamics .......................................................................................... 60 Impact Analysis ............................................................................................ 60 Market Drivers .............................................................................................. 62 4.8.1 Growing Number of Genetic Tests ................................................... 62 4.8.2 Increasing Demand for Reliable Next-Generation Sequencing (NGS) Results ............................................................... 63 4.8.3 Rise in the Prevalence of Infectious Disease .................................. 63 4.8.4 Rise in the Field of Microbial Sequencing ....................................... 64 4.8.5 Increasing Research Funding in the Field of Molecular Biology ............................................................................................... 65 4.8.6 Increase in Awareness and Acceptance of Personalized Medicines on a Global Level ............................................................ 66 4.8.7 Decreasing Cost of Sequencing....................................................... 67 4.9 Market Restraints ......................................................................................... 68 4.9.1 Genomic Data Protection .................................................................. 68 4.9.2 High Cost of Automated Instruments .............................................. 69 4.9.3 Rigid Regulatory Standards ............................................................. 69 4.10Market Opportunities ................................................................................... 70 4.10.1 Evolution of Biobanking in Healthcare ............................................ 70 4.10.2 Capitalizing on the High Prevalence of Genetic Disorders ............ 70 4.10.3 Growth in Emerging Nations ............................................................ 72 4.10.4 Massive Scope for Adoption of NGS-based Genetic Tests in Emerging Markets ............................................................................. 72 4.3.2 4.3.3 4.3.4 4.4 4.5 4.6 4.7 4.8 5. Nucleic Acid Isolation and Purification Market: Industry Insights ................. 74 5.1 Key Developments ....................................................................................... 74 5.1.1 Product Launches and Enhancements ........................................... 75 5.1.2 Collaborations and Agreements ...................................................... 76 All rights reserved at BIS Research 4
Global Nucleic Acid Isolation and Purification Market 5.1.3 5.1.4 Acquisitions ....................................................................................... 77 Business Expansions ....................................................................... 77 Industry Trends ............................................................................................ 78 5.2.1 Emergence of Advanced Stabilization Products ............................ 78 5.2.2 Regulated vs. Multimodal Analysis .................................................. 79 5.2.3 Novel Targets for Isolation and Purification ................................... 79 5.2.4 Exploring New Applications ............................................................. 80 5.2.5 Other Key Trends .............................................................................. 83 5.2 6. Nucleic Acid Isolation and Purification Market: End User and Pricing Analysis ............................................................................................................... 85 6.1 6.2 6.3 6.4 Satisfaction Level of Different Instruments (by Brand) ............................ 85 Pricing Analysis of Preferred Instruments ................................................. 87 Pricing Analysis - Accessories and Components ..................................... 88 Pricing Analysis – Consumables ................................................................ 88 7. Nucleic Acid Isolation and Purification Market (by Product), $Million, 2020- 2031 ..................................................................................................................... 90 7.1 7.2 Introduction .................................................................................................. 90 Consumables ................................................................................................ 91 7.2.1 Kits ...................................................................................................... 92 7.2.2 Reagents ............................................................................................ 93 7.3 Instruments ................................................................................................... 94 8. Nucleic Acid Isolation and Purification Kits Market, $Million, 2020-2031 ...... 95 8.1 By Workflow ................................................................................................. 95 8.1.1 Sample Isolation/Extraction/Purification ......................................... 96 8.1.2 DNA/RNA Clean-Up and Concentration ........................................... 97 8.1.3 DNA and RNA Quantification ........................................................... 98 8.2 By Analyte ..................................................................................................... 98 8.2.1 DNA ..................................................................................................... 99 8.2.2 RNA ................................................................................................... 102 All rights reserved at BIS Research 5
Global Nucleic Acid Isolation and Purification Market 9. DNA Isolation and Purification Kits Market, (by Source Type) $Million, 2020- 2031 ................................................................................................................... 104 9.1 Cell-Free ...................................................................................................... 105 9.1.1 By Sample ........................................................................................ 106 9.1.1.1 Blood ................................................................................................. 106 9.1.1.2 Serum/Plasma ................................................................................... 107 9.1.1.3 Other Sources ................................................................................... 108 9.1.2 By Application ................................................................................. 109 9.1.2.1 Parental and Hereditary Testing ........................................................ 109 9.1.2.2 Tumor Testing ................................................................................... 110 9.1.2.3 Transplantation .................................................................................. 111 9.2 Genomic ...................................................................................................... 112 9.2.1 Blood ................................................................................................ 115 9.2.2 Body Fluids ...................................................................................... 117 9.2.3 Buccal ............................................................................................... 118 9.2.4 Cell/Cultured Cell............................................................................. 120 9.2.5 FFPE ................................................................................................. 122 9.2.6 Forensic ........................................................................................... 124 9.2.7 Plant .................................................................................................. 126 9.2.8 Saliva/Swab ...................................................................................... 128 9.2.9 Serum/Plasma .................................................................................. 130 9.2.10 Tissue ............................................................................................... 132 9.2.11 Stool, Urine, and Other Samples .................................................... 134 9.3 Microbe ....................................................................................................... 137 9.3.1 Bacterial ........................................................................................... 138 9.3.2 Fungus ............................................................................................. 140 9.3.3 Yeast ................................................................................................. 142 9.3.4 Other Sources .................................................................................. 144 9.4 Plasmid ....................................................................................................... 145 9.4.1 GigaPrep .......................................................................................... 147 9.4.2 MaxiPrep .......................................................................................... 148 9.4.3 MegaPrep ......................................................................................... 150 All rights reserved at BIS Research 6
Global Nucleic Acid Isolation and Purification Market 9.4.4 9.4.5 MidiPrep ........................................................................................... 152 MiniPrep ........................................................................................... 153 Viral ............................................................................................................. 156 9.5 10. RNA Isolation and Purification Kits Market (by Source Type) $Million, 2020- 2031 ................................................................................................................... 158 10.1Genomic RNA ............................................................................................. 159 10.1.1 Blood ................................................................................................ 161 10.1.2 Body Fluids ...................................................................................... 162 10.1.3 Cell/Cultured Cell............................................................................. 163 10.1.4 FFPE ................................................................................................. 165 10.1.5 Plant .................................................................................................. 167 10.1.6 Saliva/Swab ...................................................................................... 168 10.1.7 Serum/Plasma .................................................................................. 169 10.1.8 Tissue ............................................................................................... 171 10.1.9 Urine ................................................................................................. 172 10.1.10 Others ............................................................................................... 173 10.2Microbial RNA ............................................................................................. 174 10.2.1 Bacteria ............................................................................................ 176 10.2.2 Yeast ................................................................................................. 177 10.2.3 Fungus ............................................................................................. 179 10.2.4 Others ............................................................................................... 180 10.3Viral RNA ..................................................................................................... 181 10.4Cell-Free RNA ............................................................................................. 183 10.4.1 Serum/Plasma .................................................................................. 184 10.4.2 Others ............................................................................................... 185 11. Nucleic Acid Isolation and Purification Consumables Market (by Technology), $Million, 2020-2031 .................................................................... 187 11.1Silica-Based ................................................................................................ 188 11.2Magnetic Particle Technology ................................................................... 189 11.3Other Technologies ................................................................................... 190 All rights reserved at BIS Research 7
Global Nucleic Acid Isolation and Purification Market 12. Nucleic Acid Isolation and Purification Consumables Market (by Downstream Applications), $Million, 2020-2031 ............................................ 193 12.1PCR ............................................................................................................. 194 12.2qPCR ........................................................................................................... 195 12.3NGS ............................................................................................................. 195 12.4Cloning ........................................................................................................ 196 12.5Microarray ................................................................................................... 197 12.6Blotting Techniques ................................................................................... 198 12.7Other Applications ..................................................................................... 199 13. Nucleic Acid Isolation and Purification Consumables Market (by End User), $Million, 2020-2031 ........................................................................................... 201 13.1Introduction ................................................................................................ 201 13.2Academic Research Institutes and Laboratories .................................... 202 13.3Pharmaceutical and Biotechnology Companies ..................................... 204 13.4Contract Research Organizations ............................................................ 205 13.5Applied Testing .......................................................................................... 207 13.6Clinical Diagnostic Centers ....................................................................... 209 14. Nucleic Acid Isolation and Purification Consumables Market (by Region) . 211 14.1North America ............................................................................................ 213 14.1.1 U.S. ................................................................................................... 216 14.1.2 Canada ............................................................................................. 217 14.2Europe, Middle East & Africa (EMEA) ...................................................... 218 14.3Latin America (LATAM).............................................................................. 222 14.4Asia-Pacific ................................................................................................. 224 14.4.1 China ................................................................................................ 227 14.4.2 Japan ................................................................................................ 228 14.4.3 Rest-of-APAC ................................................................................... 229 15. Nucleic Acid Isolation and Purification Instrument Market .......................... 231 15.1Introduction ................................................................................................ 231 All rights reserved at BIS Research 8
Global Nucleic Acid Isolation and Purification Market 15.2Nucleic Acid Isolation and Purification Instrument Market (by Workflow) .................................................................................................... 231 15.2.1 Isolation/Extraction/Purification ..................................................... 232 15.2.2 Quality Control/Quantification ....................................................... 233 15.3Nucleic Acid Isolation and Purification Instrument Market (by Technology) ................................................................................................ 235 15.3.1 Automated Spin Column-Based Instruments ............................... 236 15.3.2 Magnetic Bead-based Instruments ................................................ 237 15.3.3 Automated Liquid Handling Instruments ...................................... 238 15.4Nucleic Acid Isolation and Purification Instrument Market (by Throughput) ................................................................................................ 240 15.4.1 Low Throughput Instruments ......................................................... 241 15.4.2 Medium Throughput Instruments .................................................. 242 15.4.3 High Throughput Instruments ........................................................ 243 15.5Quality Control/Quantification Instruments (by Technology) ................ 245 15.5.1 Spectrophotometer ......................................................................... 246 15.5.2 Fluorometers ................................................................................... 247 15.5.3 Others ............................................................................................... 248 15.6Nucleic Acid Isolation and Purification Instrument Market (by End User) ............................................................................................................ 250 15.6.1 Academic Research Institutes ....................................................... 251 15.6.2 Pharmaceutical and Biotechnology Companies .......................... 252 15.6.3 Clinical Diagnostic Centers ............................................................ 253 15.6.4 Applied Testing (Biobanks, Forensic and Veterinary Laboratories) ................................................................................... 254 15.6.5 Contract Research Organizations .................................................. 255 15.7Nucleic Acid Isolation and Purification Instrument Market (by Region) ........................................................................................................ 257 15.7.1 North America .................................................................................. 258 15.7.1.1U.S. ................................................................................................... 259 15.7.1.2Canada .............................................................................................. 260 15.7.2 Europe, Middle East and Africa ...................................................... 261 15.7.3 Asia-Pacific ...................................................................................... 264 All rights reserved at BIS Research 9
Global Nucleic Acid Isolation and Purification Market 15.7.3.1China ................................................................................................. 265 15.7.3.2Japan ................................................................................................. 266 15.7.3.3Rest-of-APAC .................................................................................... 267 15.7.4 Latin America ................................................................................... 269 16. Nucleic Acid Isolation and Purification Market Competitive Landscape ..... 270 16.1Market Share Analysis (Regional and Global) ......................................... 270 16.1.1 Global ............................................................................................... 270 16.1.2 North America .................................................................................. 272 16.1.3 EMEA ................................................................................................ 274 16.2Growth Share Matrix by End User ............................................................ 276 16.3Growth Share Matrix by Region ................................................................ 278 16.4Growth Share Matrix by Products ............................................................ 279 17. Strategic Recommendations ........................................................................... 281 17.1Key Takeaways ........................................................................................... 281 17.2Gap Analysis .............................................................................................. 281 17.3Business Expansion Opportunity Mapping ............................................. 283 17.3.1 By Product ....................................................................................... 283 17.3.2 By Region ......................................................................................... 284 17.4Investment Opportunities .......................................................................... 285 17.5SWOT Analysis ........................................................................................... 293 17.6Propitious Strategies to Succeed in Nucleic Acid Isolation and Purification Market ..................................................................................... 294 18. Company Profiles ............................................................................................. 295 18.1Overview ..................................................................................................... 295 18.2Agilent Technologies, Inc. ......................................................................... 296 18.2.1 Company Overview ......................................................................... 296 18.2.2 Role of Agilent Technologies, Inc. in the Global Nucleic Acid Isolation and Purification Market ................................................... 296 18.2.3 Financials ......................................................................................... 298 18.2.4 Key Insights About Financial of the Company ............................. 301 18.2.5 SWOT Analysis ................................................................................ 302 All rights reserved at BIS Research 10
Global Nucleic Acid Isolation and Purification Market 18.3Analytik Jena AG ........................................................................................ 303 18.3.1 Company Overview ......................................................................... 303 18.3.2 Role of Analytik Jena AG in the Global Nucleic Acid Isolation and Purification Market ................................................... 303 18.3.3 SWOT Analysis ................................................................................ 305 18.4AutoGen, Inc. .............................................................................................. 306 18.4.1 Company Overview ......................................................................... 306 18.4.2 Role of Autogen, Inc. in the Global Nucleic Acid Isolation and Purification Market ................................................................... 306 18.4.3 SWOT Analysis ................................................................................ 308 18.5Bio-Rad Laboratories, Inc. ......................................................................... 309 18.5.1 Company Overview ......................................................................... 309 18.5.2 Role of Bio-Rad Laboratories, Inc. in the Global Nucleic Acid Isolation and Purification Market ................................................... 309 18.5.3 Financials ......................................................................................... 311 18.5.4 Key Insights About Financial Health of the Company ................. 313 18.5.5 SWOT Analysis ................................................................................ 314 18.6F. Hoffmann-La Roche AG ......................................................................... 315 18.6.1 Company Overview ......................................................................... 315 18.6.2 Role of F. Hoffmann-La Roche AG in the Global Nucleic Acid Isolation and Purification Market ................................................... 315 18.6.3 Financials ......................................................................................... 317 18.6.4 Key Insights About Financial Health of the Company ................. 319 18.6.5 SWOT Analysis ................................................................................ 320 18.7Illumina, Inc. ............................................................................................... 321 18.7.1 Company Overview ......................................................................... 321 18.7.2 Role of Illumina, Inc. in the Global Nucleic Acid Isolation and Purification Market .......................................................................... 321 18.7.3 Financials ......................................................................................... 323 18.7.4 Key Insights About Financial Health of the Company ................. 326 18.7.5 SWOT Analysis ................................................................................ 327 18.8Merck KGaA ................................................................................................ 328 18.8.1 Company Overview ......................................................................... 328 All rights reserved at BIS Research 11
Global Nucleic Acid Isolation and Purification Market Role of Merck KGaA in the Global Nucleic Acid Isolation and Purification Market .......................................................................... 328 Financials ......................................................................................... 330 Key Insights About Financial Health of the Company ................. 332 SWOT Analysis ................................................................................ 333 18.9Meridian Bioscience, Inc. .......................................................................... 334 18.9.1 Company Overview ......................................................................... 334 18.9.2 Role of Meridian Bioscience in the Global Nucleic Acid Isolation and Purification Market ................................................... 334 18.9.3 Financials ......................................................................................... 335 18.9.4 Key Insights about Financial Health of the Company .................. 337 18.9.5 SWOT Analysis ................................................................................ 338 18.10Macherey-Nagel GmbH & Co KG .............................................................. 339 18.10.1 Company Overview ......................................................................... 339 18.10.2 Role of Macherey-Nagel GmbH & Co KG in the Global Nucleic Acid Isolation and Purification Market ............................. 339 18.10.3 SWOT Analysis ................................................................................ 341 18.11New England Biolabs, Inc .......................................................................... 342 18.11.1 Company Overview ......................................................................... 342 18.11.2 Role of New England Biolabs, Inc. in the Global Nucleic Acid Isolation and Purification Market ................................................... 342 18.11.3 SWOT Analysis ................................................................................ 344 18.12Norgen Biotek Corp. .................................................................................. 345 18.12.1 Company Overview ......................................................................... 345 18.12.2 Role of Norgen Biotek Corp. in the Global Nucleic Acid Isolation and Purification Market ................................................... 345 18.12.3 SWOT Analysis ................................................................................ 347 18.13Omega Bio-tek, Inc. .................................................................................... 348 18.13.1 Company Overview ......................................................................... 348 18.13.2 Role of Omega Bio-tek, Inc., in the Global Nucleic Acid Isolation and Purification Market ................................................... 348 18.13.3 SWOT Analysis ................................................................................ 350 18.14Orasure Technologies, Inc. ....................................................................... 351 18.8.2 18.8.3 18.8.4 18.8.5 All rights reserved at BIS Research 12
Global Nucleic Acid Isolation and Purification Market Company Overview ......................................................................... 351 Role of Orasure Technologies in the Global Nucleic Acid Isolation and Purification Market ................................................... 351 Financials ......................................................................................... 352 Key Insights about Financial Health of the Company .................. 354 SWOT Analysis ................................................................................ 355 18.15PerkinElmer, Inc. ........................................................................................ 356 18.15.1 Company Overview ......................................................................... 356 18.15.2 Role of PerkinElmer, Inc. in the Nucleic Acid Isolation and Purification Market .......................................................................... 356 18.15.3 Financials ......................................................................................... 358 18.15.4 SWOT Analysis ................................................................................ 361 18.16Promega Corporation ................................................................................ 362 18.16.1 Company Overview ......................................................................... 362 18.16.2 Role of Promega Corporation in the Global Nucleic Acid Isolation and Purification Market ................................................... 362 18.16.3 SWOT Analysis ................................................................................ 364 18.17QIAGEN N.V. ............................................................................................... 365 18.17.1 Company Overview ......................................................................... 365 18.17.2 Role of QIAGEN N.V. plc in the Global Nucleic Acid Isolation and Purification Market ................................................................... 365 18.17.3 Financials ......................................................................................... 367 18.17.4 Key Insights About Financial Health of the Company ................. 370 18.17.5 SWOT Analysis ................................................................................ 371 18.18Sage Science, Inc. ...................................................................................... 372 18.18.1 Company Overview ......................................................................... 372 18.18.2 Role of Sage Science, Inc. in the Global Nucleic Acid Isolation and Purification Market ................................................... 372 18.18.3 SWOT Analysis ................................................................................ 374 18.19Tecan Group ............................................................................................... 375 18.19.1 Company Overview ......................................................................... 375 18.19.2 Role of Tecan Group in the Global Nucleic Acid Isolation and Purification Market ................................................................... 375 18.14.1 18.14.2 18.14.3 18.14.4 18.14.5 All rights reserved at BIS Research 13
Global Nucleic Acid Isolation and Purification Market 18.19.3 18.19.4 18.19.5 18.20ThermoFisher Scientific Inc. ..................................................................... 380 18.20.1 Company Overview ......................................................................... 380 18.20.2 Role of Thermo Fisher Scientific in the Global Nucleic Acid Isolation and Purification Market ................................................... 380 18.20.3 Financials ......................................................................................... 382 18.20.4 Key Insights About Financial Health of the Company ................. 385 18.20.5 SWOT Analysis ................................................................................ 386 18.21Zymo Research .......................................................................................... 387 18.21.1 Company Overview ......................................................................... 387 18.21.2 Role of Zymo Research in the Global Nucleic Acid Isolation and Purification Market ................................................................... 387 18.21.3 SWOT Analysis ................................................................................ 389 18.22Emerging Companies ................................................................................ 390 Financials ......................................................................................... 376 Key Insights about Financial Health of the Company .................. 378 SWOT Analysis ................................................................................ 379 All rights reserved at BIS Research 14
Global Nucleic Acid Isolation and Purification Market List of Tables List of Tables Table 4.1: Likert Scale ..................................................................................................................... 61 Table 4.2: Impact Analysis of Market Drivers ................................................................................... 61 Table 4.3: Impact Analysis of Market Restraints .............................................................................. 62 Table 4.4: Other Key Research Funding for Nucleic Acid Extraction ............................................... 65 Table 5.1: Commercially Available CTC Isolation Technologies ...................................................... 81 Table 5.2: Key Market Players Offering Ultra Pure Extraction Kits ................................................... 83 Table 6.1: Key Automated DNA Extraction/Isolation/Purification and Quantification/Quality Control Systems Price and Material Cost per Sample ...................................................................... 87 Table 6.2: Pricing of Market Available Consumables ....................................................................... 88 Table 11.1: Other Technologies Consumables Market, $Million, 2020-2031 ................................. 191 Table 13.1: Academic Research Institutes and Laboratories Consumables Market (by Analyte), $Million, 2020-2031 ........................................................................................................... 202 Table 13.2: Pharmaceutical and Biotechnology Companies Consumables Market (by Analyte), $Million, 2020-2031 ........................................................................................................... 205 Table 13.3: Contract Research Organizations Consumables Market (by Analyte), $Million, 2020- 2031 ................................................................................................................................... 206 Table 13.4: Applied Testing Consumables Market, (by Analyte) $Million, 2020-2031 .................... 208 Table 13.5: Clinical Diagnostic Center Consumables Market (by Analyte), $Million, 2020-2031 ... 209 Table 14.1: Global Nucleic Acid Isolation and Purification Consumables Market (by Region), $Million, 2020-2031 ........................................................................................................... 212 Table 14.2: Global DNA Isolation and Purification Kits Market (by Region), $Million, 2020-2031 .. 212 Table 14.3: Global RNA Isolation and Purification Kits Market (by Region), $Million, 2020-2031 .. 212 Table 14.4: Global Nucleic Acid Isolation and Purification Reagents Market (by Region), $Million, 2020-2031 ......................................................................................................................... 213 Table 14.5: North America Nucleic Acid Isolation and Purification Consumables Market (by Analyte), $Million, 2020-2031 ........................................................................................................... 214 Table 14.6: North America DNA Isolation and Purification Kits Market (by Source), $Million, 2020- 2031 ................................................................................................................................... 215 Table 14.7: North America RNA Isolation and Purification Kits Market (by Source), $Million, 2020- 2031 ................................................................................................................................... 215 All rights reserved at BIS Research 15
Global Nucleic Acid Isolation and Purification Market Table 14.8: EMEA Nucleic Acid Isolation and Purification Consumables Market (by Country), $Million, 2020-2031 ........................................................................................................... 219 Table 14.9: EMEA Nucleic Acid Isolation and Purification Consumables Market (by Analyte), $Million, 2020-2031 ........................................................................................................... 219 Table 14.10: EMEA DNA Isolation and Purification Kits Market (by Source), $Million, 2020-2031 220 Table 14.11: EMEA RNA Isolation and Purification Kits Market (by Source), $Million, 2020-2031 220 Table 14.12: LATAM Nucleic Acid Isolation and Purification Consumables Market (by Country), $Million, 2020-2031 ........................................................................................................... 222 Table 14.13: LATAM Nucleic Acid Isolation and Purification Consumables Market (by Analyte), $Million, 2020-2031 ........................................................................................................... 223 Table 14.14: LATAM DNA Isolation and Purification Kits Market (by Source), $Million, 2020-2031 ........................................................................................................................................... 223 Table 14.15: LATAM RNA Isolation and Purification Kits Market (by Source), $Million, 2020-2031 ........................................................................................................................................... 224 Table 14.16: APAC Nucleic Acid Isolation and Purification Consumables Market (by Country), $Million, 2020-2031 ........................................................................................................... 225 Table 14.17: APAC Nucleic Acid Isolation and Purification Consumables Market (by Analyte), $Million, 2020-2031 ........................................................................................................... 226 Table 14.18: APAC DNA Isolation and Purification Kits Market (by Source), $Million, 2020-2031 . 226 Table 14.19: APAC RNA Isolation and Purification Kits Market (by Source), $Million, 2020-2031 . 226 Table 15.1: Key Isolation/Extraction/Purification Systems for Nucleic Acids .................................. 233 Table 15.2: Key Quality Control/Quantification Systems for Nucleic Acids .................................... 234 Table 15.3: Key Column-Based Systems for Nucleic Acid Extraction ............................................ 237 Table 15.4: Key Magnetic Bead-Based Systems for Nucleic Acid Extraction ................................ 238 Table 15.5: Key Automated Liquid Handling Instruments for Nucleic Acid Extraction .................... 239 Table 15.6: Key Low Throughput Systems for Nucleic Acid Extraction .......................................... 242 Table 15.7: Key Medium Throughput Systems for Nucleic Acid Extraction .................................... 243 Table 15.8: Key High Throughput Systems for Nucleic Acid Extraction ......................................... 245 Table 15.9: Key Spectrophotometer Systems for Quality Control/Quantification ........................... 247 Table 15.10: Key Fluorometers Systems for Quality Control/Quantification ................................... 248 Table 15.11: Key Other Systems for Quality Control/Quantification ............................................... 249 Table 15.12: Collaborations in Genetics and Genomics Research in Africa, by Funder ................ 263 All rights reserved at BIS Research 16
Global Nucleic Acid Isolation and Purification Market Table 17.1: Major Issues in Research Laboratories in the Asia-Pacific Region ............................. 282 Table 17.2: Funding Scenario in the Competitive Genomic Landscape ......................................... 286 All rights reserved at BIS Research 17
Global Nucleic Acid Isolation and Purification Market List of List of Figures Figures Figure 1: Cumulative Number of Tested Conditions and Associated Genes for Genetic Testing, 2012-2019 ........................................................................................................................... 32 Figure 2: Impact Analysis on the Global Nucleic Acid Isolation and Purification Market .................. 33 Figure 3: Nucleic Acid Isolation and Purification Market, (by Product), $Million, 2020 vs. 2031 ....... 34 Figure 4: Nucleic Acid Isolation and Purification Consumables Market, (by Type), $Million, 2020 vs. 2031 ..................................................................................................................................... 35 Figure 5: Nucleic Acid Isolation and Purification Consumables Market, (by Technology), $Million, 2020 vs. 2031 ...................................................................................................................... 35 Figure 6: Nucleic Acid Isolation and Purification Consumables Market, (by End User), $Million, 2020 vs. 2031 ............................................................................................................................... 36 Figure 7: Global Nucleic Acid Isolation and Purification Consumables Market Snapshot, (by Region) 2020 and 2031 ..................................................................................................................... 37 Figure 8: Nucleic Acid Isolation and Purification Instrument Market, (by Technology), $Million, 2020 vs. 2031 ............................................................................................................................... 38 Figure 9: Nucleic Acid Isolation and Purification Instrument Market, (by Throughput), $Million, 2020 vs. 2031 ............................................................................................................................... 38 Figure 10: Global Nucleic Acid Isolation and Purification Instrument Market Snapshot, (by Region) 39 Figure 2.1: Global Nucleic Acid Isolation and Purification Market Segmentation ............................. 42 Figure 3.1: Global Nucleic Acid Isolation and Purification Market Methodology ............................... 43 Figure 3.2: Primary Research Methodology ..................................................................................... 44 Figure 3.3: Bottom-Up Approach (Segment-Wise Analysis) ............................................................ 46 Figure 3.4: Forecast Methodology ................................................................................................... 47 Figure 4.1: North America Nucleic Acid Isolation and Purification Addressable Market, 2020-2031 54 Figure 4.2: EMEA Nucleic Acid Isolation and Purification Addressable Market, 2020-2031 ............ 55 Figure 4.3: Asia-Pacific Nucleic Acid Isolation and Purification Addressable Market, 2020-2031 ... 56 Figure 4.4: Latin America Nucleic Acid Isolation and Purification Addressable Market, 2020-2031 57 Figure 4.5: Market Attractiveness Based on Key Characteristics ..................................................... 58 Figure 4.6: Impact of COVID-19 on the Global Nucleic Acid Isolation and Purification Market ........ 60 Figure 4.5: Decreasing Cost and Increasing Output (TB) of Genome Sequencing (2009-2025) .... 67 Figure 4.6: Key Genetic Disorder Prevalence in the U.S., 2012-2017 ............................................. 71 All rights reserved at BIS Research 18
Global Nucleic Acid Isolation and Purification Market Figure 5.1: Share of Key Developments and Strategies .................................................................. 75 Figure 6.1: Nucleic Acid Isolation and Purification Customer Preference (by Major Brand), N=27 .. 85 Figure 6.2: Nucleic Acid Isolation and Purification Customer Satisfaction Level (5 Being the Highest) (by Brand) (N=27) ................................................................................................................ 86 Figure 7.1: Nucleic Acid Isolation and Purification Market (by Product), $Million, 2020 and 2031 .. 90 Figure 7.2: Nucleic Acid Isolation and Purification Consumables Market, $Million, 2020-2031 ....... 91 Figure 7.3: Nucleic Acid Isolation and Purification Kits Market, $Million, 2020-2031 ........................ 92 Figure 7.4: Nucleic Acid Isolation and Purification Reagents Market, $Million, 2020-2031 .............. 93 Figure 7.5: Nucleic Acid Isolation and Purification Instrument Market, $Million, 2020-2031 ............. 94 Figure 8.1: Nucleic Acid Isolation and Purification Kits Market (by Workflow), $Million, 2020 and 2031 ..................................................................................................................................... 95 Figure 8.2: Sample Isolation/Extraction/Purification Kits Market, $Million, 2020-2031 ..................... 96 Figure 8.3: DNA/RNA Clean-Up and concentration Kits Market, $Million, 2020-2031 ..................... 97 Figure 8.4: DNA and RNA Quantification Kits Market, $Million, 2020-2031 ..................................... 98 Figure 8.5: Nucleic Acid Isolation and Purification Kits Market (by Analyte), $Million, 2020 and 2031 ............................................................................................................................................. 99 Figure 8.6: DNA Kits Market, $Million, 2020-2031 ......................................................................... 100 Figure 8.7: Market Share for DNA Kits Market, $Million, 2020 ....................................................... 101 Figure 8.8: RNA Kits Market, $Million, 2020-2031 ......................................................................... 102 Figure 8.9: Market Share for RNA Kits Market, $Million, 2020 ....................................................... 103 Figure 9.1: DNA Isolation and Purification Kits Market (by Source Type), $Million, 2020 and 2031 ........................................................................................................................................... 104 Figure 9.2: Cell-Free DNA Isolation and Purification Kits Market, $Million, 2020-2031 .................. 105 Figure 9.3: Market Share for Cell-Free DNA Isolation and Purification Kits Market, $Million, 2020 ........................................................................................................................................... 106 Figure 9.4: Cell-Free DNA Isolation and Purification Kits Market for Blood, $Million, 2020-2031 .. 107 Figure 9.5: Cell-Free DNA Isolation and Purification Kits Market for Serum/Plasma, $Million, 2020- 2031 ................................................................................................................................... 108 Figure 9.6: Cell-Free DNA Isolation and Purification Kits Market for Other Sources, $Million, 2020- 2031 ................................................................................................................................... 109 Figure 9.7: Cell-Free DNA Isolation and Purification Kits Market for Prenatal and Hereditary Testing, $Million, 2020-2031 ........................................................................................................... 110 All rights reserved at BIS Research 19
Global Nucleic Acid Isolation and Purification Market Figure 9.8: Cell-Free DNA Isolation and Purification Kits Market for Tumor Testing, $Million, 2020- 2031 ................................................................................................................................... 111 Figure 9.9: Cell-Free DNA Isolation and Purification Kits Market for Transplantation, $Million, 2020- 2031 ................................................................................................................................... 112 Figure 9.10: Genomic DNA Isolation and Purification Kits Market, $Million, 2020-2031 ................ 113 Figure 9.11: Market Share for Genomic DNA Isolation and Purification Kits Market, $Million, 2020 ........................................................................................................................................... 114 Figure 9.12: Genomic DNA Isolation and Purification Kits Market for Blood, $Million, 2020-2031 . 115 Figure 9.13: Market Share for Genomic DNA Isolation and Purification Market for Blood, $Million, 2020 ................................................................................................................................... 116 Figure 9.14: Genomic DNA Isolation and Purification Kits Market for Body Fluids, $Million, 2020- 2031 ................................................................................................................................... 117 Figure 9.15: Market Share for Genomic DNA Isolation and Purification Kits Market for Body Fluids, $Million, (2020) .................................................................................................................. 118 Figure 9.16: Genomic DNA Isolation and Purification Kits Market for Buccal, $Million, 2020-2031 ........................................................................................................................................... 119 Figure 9.17: Market Share for Genomic DNA Isolation and Purification Kits Market for Buccal, $Million, 2020 ..................................................................................................................... 120 Figure 9.18: Genomic DNA Isolation and Purification Kits Market for Cell/Cultured Cell, $Million, 2020-2031 ......................................................................................................................... 121 Figure 9.19: Market Share for Genomic DNA Isolation and Purification Kits Market for Cell/Cultured Cell, $Million, 2020............................................................................................................. 122 Figure 9.20: Genomic DNA Isolation and Purification Kits Market for FFPE, $Million, 2020-2031 123 Figure 9.21: Market Share for Genomic DNA Isolation and Purification Kits Market for FFPE, $Million, 2020 ..................................................................................................................... 124 Figure 9.22: Genomic DNA Isolation and Purification Kits Market for Forensic, $Million, 2020-2031 ........................................................................................................................................... 125 Figure 9.23: Market Share for Genomic DNA Isolation and Purification Kits Market for Forensic, $Million, 2020 ..................................................................................................................... 126 Figure 9.24: Genomic DNA Isolation and Purification Kits Market for Plant, $Million, 2020-2031 . 127 Figure 9.25: Market Share for Genomic DNA Isolation and Purification Kits Market for Plant, $Million, 2020 ..................................................................................................................... 128 All rights reserved at BIS Research 20
Global Nucleic Acid Isolation and Purification Market Figure 9.26: Genomic DNA Isolation and Purification Kits Market for Saliva/Swab, $Million, 2020- 2031 ................................................................................................................................... 129 Figure 9.27: Market Share for Genomic DNA Isolation and Purification Kits Market for Saliva/Swab, $Million, 2020 ..................................................................................................................... 130 Figure 9.28: Genomic DNA Isolation and Purification Kits Market for Serum/Plasma, $Million, 2020- 2031 ................................................................................................................................... 131 Figure 9.29: Market Share for Genomic DNA Isolation and Purification Kits Market for Serum/Plasma, $Million, 2020 ........................................................................................... 132 Figure 9.30: Genomic DNA Isolation and Purification Kits Market for Tissue, $Million, 2020-2031 133 Figure 9.31: Market Share for Genomic DNA Isolation and Purification Kits Market for Tissue, $Million, 2020 ..................................................................................................................... 134 Figure 9.32: Genomic DNA Isolation and Purification Kits Market for Combined Segment, $Million, 2020-2031 ......................................................................................................................... 135 Figure 9.33: Market Share for Genomic DNA Isolation and Purification Kits Market for Stool, Urine, and Other Samples, $Million, 2020 .................................................................................... 136 Figure 9.34: Microbe DNA Isolation and Purification Kits Market, $Million, 2020-2031 .................. 137 Figure 9.35: Market Share for Microbe DNA Isolation and Purification Kits Market, $Million, 2020 ........................................................................................................................................... 138 Figure 9.36: Microbial DNA Isolation and Purification Kits Market for Bacterial, $Million, 2020-2031 ........................................................................................................................................... 139 Figure 9.37: Market Share for Microbial DNA Isolation and Purification Kits Market for Bacterial, $Million, 2020 ..................................................................................................................... 140 Figure 9.38: Microbial DNA Isolation and Purification Kits Market for Fungus, $Million, 2020-2031 ........................................................................................................................................... 141 Figure 9.39: Market Share for Microbial DNA Isolation and Purification Kits Market for Fungus, $Million, 2020 ..................................................................................................................... 142 Figure 9.40: Microbial DNA Isolation and Purification Kits Market for Yeast, $Million, 2020-2031 . 143 Figure 9.41: Market Share for Microbial DNA Isolation and Purification Kits Market for Yeast, $Million, 2020 ..................................................................................................................... 144 Figure 9.42: Microbial DNA Isolation and Purification Kits Market for Other Sources, $Million, 2020- 2031 ................................................................................................................................... 145 Figure 9.43: Plasmid DNA Isolation and Purification Kits Market, $Million, 2020-2031 .................. 145 All rights reserved at BIS Research 21
Global Nucleic Acid Isolation and Purification Market Figure 9.44: Market Share for Plasmid DNA Isolation and Purification Kits Market, $Million, 2020 ........................................................................................................................................... 146 Figure 9.45: Plasmid GigaPrep Isolation and Purification Kits Market, $Million, 2020-2031 .......... 147 Figure 9.46: Market Share for Plasmid GigaPrep Isolation and Purification Kits Market, $Million, 2020 ................................................................................................................................... 148 Figure 9.47: Plasmid MaxiPrep Isolation and Purification Kits Market, $Million, 2020-2031 .......... 149 Figure 9.48: Market Share for Plasmid MaxiPrep Isolation and Purification Kits Market, $Million, 2020 ................................................................................................................................... 149 Figure 9.49: Plasmid MegaPrep Isolation and Purification Kits Market, $Million, 2020-2031 ......... 150 Figure 9.50: Market Share for Plasmid MegaPrep Isolation and Purification Kits Market, $Million, 2020 ................................................................................................................................... 151 Figure 9.51: Plasmid MidiPrep Isolation and Purification Kits Market, $Million, 2020-2031 ........... 152 Figure 9.52: Market Share for Plasmid MidiPrep Isolation and Purification Kits Market, $Million, 2020 ................................................................................................................................... 153 Figure 9.53: Plasmid MiniPrep Isolation and Purification Kits Market, $Million, 2020-2031 ........... 154 Figure 9.54: Market Share for Plasmid MiniPrep Isolation and Purification Kits Market, $Million, 2020 ................................................................................................................................... 155 Figure 9.55: Viral DNA Isolation and Purification Kits Market, $Million, 2020-2031........................ 156 Figure 9.56: Market Share for Viral DNA Isolation and Purification Kits Market, $Million, 2020 .... 157 Figure 10.1: RNA Isolation and Purification Kits Market, $Million, 2020 and 2031 ......................... 158 Figure 10.2: Genomic RNA Kits Market, $Million, 2020-2031 ........................................................ 159 Figure 10.3: Genomic RNA Kits Market Share, 2020..................................................................... 160 Figure 10.4: Genomic RNA Kits for Blood Market, $Million, 2020-2031 ......................................... 161 Figure 10.5: Genomic RNA Extraction Kits from Blood, Market Share, 2020 ................................. 162 Figure 10.6: Body Fluids Genomic RNA Kits Market, $Million, 2020-2031 .................................... 163 Figure 10.7: Cell/Cultured Cell Genomic RNA Kits Market, $Million, 2020-2031 ........................... 164 Figure 10.8: Cell/Cultured Cell Genomic RNA Extraction Kits, Market Share, 2020 ...................... 165 Figure 10.9: FFPE Genomic RNA Kits Market, $Million, 2020-2031 .............................................. 166 Figure 10.10: FFPE Genomic RNA Extraction Kits, Market Share, 2020 ....................................... 166 Figure 10.11: Plant Genomic RNA Kits Market, $Million, 2020-2031 ............................................. 167 Figure 10.12: Plant Genomic RNA Extraction Kits, Market Share, 2020 ........................................ 168 Figure 10.13: Saliva/Swab Genomic RNA Kits Market, $Million, 2020-2031 ................................. 169 All rights reserved at BIS Research 22
Global Nucleic Acid Isolation and Purification Market Figure 10.14: Serum/Plasma Genomic RNA Kits Market, $Million, 2020-2031 .............................. 170 Figure 10.15: Serum/Plasma Genomic RNA Extraction Kits, Market Share, 2020 ........................ 170 Figure 10.16: Tissue Genomic RNA Kits Market, $Million, 2020-2031 .......................................... 171 Figure 10.17: Tissue Genomic RNA Extraction Kits, Market Share, 2020 ..................................... 172 Figure 10.18: Urine Genomic RNA Kits Market, $Million, 2020-2031............................................. 173 Figure 10.19: Other Genomic RNA Kits Market, $Million, 2020-2031 ............................................ 174 Figure 10.20: Microbial RNA Kits Market, $Million, 2020-2031 ...................................................... 174 Figure 10.21: Microbial RNA Kits Market Share, 2020 ................................................................... 175 Figure 10.22: Bacterial RNA Kits Market, $Million, 2020-2031 ...................................................... 176 Figure 10.23: Bacterial RNA Kits Market Share, 2020 ................................................................... 177 Figure 10.24: Yeast RNA Kits Market, $Million, 2020-2031 ........................................................... 178 Figure 10.25: Yeast RNA Kits Market Share, 2020 ........................................................................ 178 Figure 10.26: Fungus RNA Kits Market, $Million, 2020-2031 ........................................................ 179 Figure 10.27: Fungal RNA Kits Market Share, 2020 ...................................................................... 180 Figure 10.28: Other Microbial RNA Kits Market, $Million, 2020-2031 ............................................ 181 Figure 10.29: Viral RNA Kits Market, $Million, 2020-2031 ............................................................. 181 Figure 10.30: Viral RNA Kits Market Share, 2020 .......................................................................... 182 Figure 10.31: Cell-Free RNA Kits Market, $Million, 2020-2031 ...................................................... 183 Figure 10.32: cell-free RNA Kits Market Share, 2020 .................................................................... 184 Figure 10.33: Serum/Plasma Cell-Free RNA Kits Market, $Million, 2020-2031 ............................. 185 Figure 10.34: Other Cell-Free RNA Kits Market, $Million, 2020-2031 ............................................ 186 Figure 11.1: Nucleic Acid Isolation and Purification Consumables Market (by Technology), $Million, 2020 and 2031 ................................................................................................................... 187 Figure 11.2: Silica-Based Consumables Market, $Million, 2020-2031 ........................................... 188 Figure 11.3: Magnetic Particle-based Consumables Market, $Million, 2020-2031 ......................... 189 Figure 12.1: Nucleic Acid Isolation and Purification Consumables Market (by Technological Downstream Applications), $Million, 2020 and 2031 ......................................................... 193 Figure 12.2: PCR Market, $Million, 2020-2031 .............................................................................. 194 Figure 12.3: qPCR Market, $Million, 2020-2031 ............................................................................ 195 Figure 12.4: NGS Market, $Million, 2020-2031 .............................................................................. 196 Figure 12.5: Cloning Market, $Million, 2020-2031 .......................................................................... 197 Figure 12.6: Microarray Market, $Million, 2020-2031 ..................................................................... 198 All rights reserved at BIS Research 23
Global Nucleic Acid Isolation and Purification Market Figure 12.7: Blotting Techniques Market, $Million, 2020-2031 ...................................................... 199 Figure 12.8: Other Applications Market, $Million, 2020-2031 ......................................................... 200 Figure 13.1: Nucleic Acid Isolation and Purification Consumables Market (by End User), $Million, 2020 and 2031 ................................................................................................................... 201 Figure 13.2: Academic Research Institutes and Laboratories Market, $Million, 2020-2031 ........... 202 Figure 13.3: Pharmaceutical and Biotechnology Companies Market, $Million, 2020-2031 ............ 204 Figure 13.4: Contract Research Organizations Market, $Million, 2020-2031 ................................. 206 Figure 13.5: Applied Testing Market, $Million, 2020-2031 ............................................................. 207 Figure 13.6: Clinical Diagnostic Center Market, $Million, 2020-2031 ............................................. 209 Figure 14.1: Nucleic Acid Isolation and Purification Consumables Market (by Region), $Million, 2020 and 2031 ............................................................................................................................ 211 Figure 14.2: North America Nucleic Acid Isolation and Purification Consumables Market, $Million, 2020-2031 ......................................................................................................................... 214 Figure 14.3: U.S. Nucleic Acid Isolation and Purification Consumables Market, $Million, 2020-2031 ........................................................................................................................................... 216 Figure 14.4: Canada Nucleic Acid Isolation and Purification Consumables Market, $Million, 2020- 2031 ................................................................................................................................... 217 Figure 14.5: EMEA Nucleic Acid Isolation and Purification Consumables Market, $Million, 2020- 2031 ................................................................................................................................... 218 Figure 14.6: LATAM Nucleic Acid Isolation and Purification Consumables Market, $Million, 2020- 2031 ................................................................................................................................... 222 Figure 14.7: APAC Nucleic Acid Isolation and Purification Consumables Market, $Million, 2020- 2031 ................................................................................................................................... 225 Figure 14.8: China Nucleic Acid Isolation and Purification Consumables Market, $Million, 2020- 2031 ................................................................................................................................... 227 Figure 14.9: Japan Nucleic Acid Isolation and Purification Consumables Market, $Million, 2020- 2031 ................................................................................................................................... 229 Figure 14.10: Rest-of-APAC Nucleic Acid Isolation and Purification Consumables Market, $Million, 2020-2031 ......................................................................................................................... 230 Figure 15.1: Nucleic Acid Isolation and Purification Instrument Market (by Workflow), $Million, 2020 and 2031 ............................................................................................................................ 231 Figure 15.2: Isolation/Extraction/Purification Instrument Market, $Million, 2020-2031 ................... 232 All rights reserved at BIS Research 24
Global Nucleic Acid Isolation and Purification Market Figure 15.3: Quality Control/Quantification Instrument Market, $Million, 2020-2031 ...................... 234 Figure 15.4: Nucleic Acid Extraction/Isolation/Purification Instrument Market (by Technology), $Million, 2020 and 2031 ..................................................................................................... 235 Figure 15.5: Automated Spin Column-Based Instrument Market, $Million, 2020-2031 .................. 236 Figure 15.6: Magnetic Bead-based Instrument Market, $Million, 2020-2031 ................................. 237 Figure 15.7: Automated Liquid Handling Instruments Market, $Million, 2020-2031 ....................... 239 Figure 15.8: Nucleic Acid Extraction/Isolation/Purification Instrument Market (by Throughput), $Million, 2020 and 2031 ..................................................................................................... 240 Figure 15.9: Low Throughput Instrument Market, $Million, 2020-2031 .......................................... 241 Figure 15.10: Medium Throughput Instrument Market, $Million, 2020-2031 .................................. 242 Figure 15.11: High Throughput Instrument Market, $Million, 2020-2031 ....................................... 244 Figure 15.12: Quality Control/Quantification Instruments, (by Technology), $Million, 2020 and 2031 ........................................................................................................................................... 245 Figure 15.13: Spectrophotometers Market, $Million, 2020-2031 .................................................... 246 Figure 15.14: Fluorometers Market, $Million, 2020-2031 ............................................................... 247 Figure 15.15: Others Market, $Million, 2020-2031 ......................................................................... 248 Figure 15.16: Nucleic Acid Isolation and Purification Instrument Market (by End User), $Million, 2020 and 2031 ................................................................................................................... 250 Figure 15.17: Nucleic Acid Isolation and Purification Instrument Market for Academic Research Institutes, $Million, 2020-2031 ........................................................................................... 251 Figure 15.18: Nucleic Acid Isolation and Purification Instrument Market for Pharmaceutical and Biotechnology Companies, $Million, 2020-2031 ................................................................ 252 Figure 15.19: Nucleic Acid Isolation and Purification Instrument Market for Clinical Diagnostic Centers, $Million, 2020-2031 ............................................................................................. 253 Figure 15.20: Nucleic Acid Isolation and Purification Instrument Market for Applied Testing, $Million, 2020-2031 ......................................................................................................................... 254 Figure 15.21: Nucleic Acid Isolation and Purification Instrument Market for Contract Research Organizations, $Million, 2020-2031 .................................................................................... 256 Figure 15.22: Nucleic Acid Isolation and Purification Instrument Market (by Region), $Million, 2020 and 2031 ............................................................................................................................ 257 Figure 15.23: North America Nucleic Acid Isolation and Purification Instrument Market, $Million, 2020-2031 ......................................................................................................................... 258 All rights reserved at BIS Research 25
Global Nucleic Acid Isolation and Purification Market Figure 15.24: North America Nucleic Acid Isolation and Purification Instrument Market (by Country), $Million, 2020-2031 ........................................................................................................... 258 Figure 15.25: U.S. Nucleic Acid Isolation and Purification Instrument Market, $Million, 2020-2031 ........................................................................................................................................... 259 Figure 15.26: Canada Nucleic Acid Isolation and Purification Instrument Market, $Million, 2020- 2031 ................................................................................................................................... 261 Figure 15.27: EMEA Nucleic Acid Isolation and Purification Instrument Market, $Million, 2020-2031 ........................................................................................................................................... 262 Figure 15.28: APAC Nucleic Acid Isolation and Purification Instrument Market, $Million, 2020-2031 ........................................................................................................................................... 264 Figure 15.29: APAC Nucleic Acid Isolation and Purification Instrument Market (by Country) $Million, 2020-2031 ......................................................................................................................... 264 Figure 15.30: China Nucleic Acid Isolation and Purification Instrument Market, $Million, 2020-2031 ........................................................................................................................................... 265 Figure 15.31: Japan Nucleic Acid Isolation and Purification Instrument Market, $Million, 2020-2031 ........................................................................................................................................... 266 Figure 15.32: Rest-of-APAC Nucleic Acid Isolation and Purification Instrument Market, $Million, 2020-2031 ......................................................................................................................... 268 Figure 15.33: LATAM Nucleic Acid Isolation and Purification Instrument Market, $Million, 2020-2031 ........................................................................................................................................... 269 Figure 16.1: Market Share Analysis for the Global Nucleic Acid Isolation and Purification (Instrument and Kits) Market, 2020 ....................................................................................................... 270 Figure 16.2: Market Share Analysis for the Global Nucleic Acid Isolation and Purification Instrument Market, 2020 ...................................................................................................................... 271 Figure 16.3: Global Nucleic Acid Isolation and Purification Kits Market Share, 2020 ..................... 272 Figure 16.4: Market Share Analysis for the North America Nucleic Acid Isolation and Purification (Instrument and Kits) Market, 2020 .................................................................................... 273 Figure 16.5: Market Share Analysis for the North America Nucleic Acid Isolation and Purification Instrument Market, 2018 .................................................................................................... 273 Figure 16.6: Market Share Analysis for the North America Nucleic Acid Isolation and Purification Kits Market, 2020 ...................................................................................................................... 274 All rights reserved at BIS Research 26
Global Nucleic Acid Isolation and Purification Market Figure 16.7: Market Share Analysis for the EMEA Nucleic Acid Isolation and Purification (Instrument and Kits) Market, 2020 ....................................................................................................... 275 Figure 16.8: Market Share Analysis for the EMEA Nucleic Acid Isolation and Purification Instrument Market, 2020 ...................................................................................................................... 275 Figure 16.9: Market Share Analysis for the EMEA Nucleic Acid Isolation and Purification Kits Market, 2020 ...................................................................................................................... 276 Figure 16.10: Growth Share Matrix for Global Nucleic Acid Isolation and Purification Market (by End User) .................................................................................................................................. 277 Figure 16.11: Growth Share Matrix for Global Nucleic Acid Isolation and Purification Market (by Region) .............................................................................................................................. 278 Figure 16.12: Growth Share Matrix for Global Nucleic Acid Isolation and Purification Market (by Product) ............................................................................................................................. 280 Figure 17.1: Business Expansion Opportunity Mapping (by Product) ............................................ 283 Figure 17.2: Business Expansion Opportunity Mapping (by Region) ............................................. 284 Figure 17.3: Nucleic Acid Isolation and Purification Market: SWOT Analysis................................. 293 Figure 18.1: Total Number of Companies Profiles ......................................................................... 295 Figure 18.2: Agilent Technologies, Inc.: Key Product Portfolio ....................................................... 297 Figure 18.3: Agilent Technologies, Inc.: Overall Financials, 2018-2020 ......................................... 298 Figure 18.4: Agilent Technologies, Inc.: Revenue (by Segment), 2018-2020 ................................ 299 Figure 18.5: Agilent Technologies, Inc.: Revenue (by Region), 2018-2020 ................................... 300 Figure 18.6: Agilent Technologies, Inc.: R&D Expenditure, 2018-2020 ......................................... 301 Figure 18.7: Agilent Technologies, Inc.: SWOT Analysis ............................................................... 302 Figure 18.8: Analytik Jena AG: Key Product Portfolio .................................................................... 304 Figure 18.9: Analytik Jena AG: SWOT Analysis ............................................................................ 305 Figure 18.10: AutoGen, Inc.: Key Product Portfolio ....................................................................... 307 Figure 18.11: AutoGen, Inc.: SWOT Analysis ................................................................................ 308 Figure 18.12: Bio-Rad Laboratories, Inc.: Key Product Portfolio .................................................... 310 Figure 18.13: Bio-Rad Laboratories, Inc.: Overall Financials, 2018-2020 ...................................... 311 Figure 18.14: Bio-Rad Laboratories, Inc.: Sales (by Segment), $Million, 2018-2020 ..................... 311 Figure 18.15: Bio-Rad Laboratories, Inc.: Sales (by Region), 2018-2020 ...................................... 312 Figure 18.16: Bio-Rad Laboratories, Inc.: R&D Expenditure, 2018-2020 ....................................... 313 Figure 18.17: Bio-Rad Laboratories, Inc.: SWOT Analysis ............................................................ 314 All rights reserved at BIS Research 27
Global Nucleic Acid Isolation and Purification Market Figure 18.18: F. Hoffmann-La Roche AG: Key Product Portfolio ................................................... 316 Figure 18.19: F. Hoffmann-La Roche AG: Overall Financials, 2018-2020 ..................................... 317 Figure 18.20: F. Hoffmann-La Roche AG: Revenue (by Segment), $Million, 2018-2020 ............... 317 Figure 18.21: F. Hoffmann-La Roche AG: Revenue (by Region), 2018-2020 ................................ 318 Figure 18.22: F. Hoffmann-La Roche AG: R&D Expenditure, 2018-2020 ...................................... 319 Figure 18.23: F. Hoffmann-La Roche AG: SWOT Analysis ........................................................... 320 Figure 18.24: Illumina, Inc.: Key Product Portfolio ......................................................................... 322 Figure 18.25: Illumina, Inc.: Overall Financials, 2018-2020............................................................ 323 Figure 18.26: Illumina, Inc.: Revenue (by Segment), $Million, 2018-2020 ..................................... 324 Figure 18.27: Illumina, Inc.: Revenue (by Region), 2018-2020 ...................................................... 325 Figure 18.28: Illumina, Inc.: R&D Expenditure, 2018-2020 ............................................................ 326 Figure 18.29: Illumina, Inc.: SWOT Analysis .................................................................................. 327 Figure 18.30: Merck KGaA: Key Product Offerings ........................................................................ 329 Figure 18.31: Merck KGaA: Overall Financials, 2018-2020 ........................................................... 330 Figure 18.32: Merck KGaA: Revenue (by Segment), $Million, 2018-2020 ..................................... 330 Figure 18.33: Merck KGaA: Revenue (by Region), 2018-2020 ...................................................... 331 Figure 18.34: Merck KGaA: R&D Expenditure, 2018-2020 ............................................................ 332 Figure 18.35: Merck KGaA: SWOT Analysis ................................................................................. 333 Figure 18.36: Meridian Bioscience: Key Product Portfolio ............................................................. 335 Figure 18.37: Meridian Bioscience: Overall Financials, 2018-2020................................................ 335 Figure 18.38: Meridian Bioscience Revenue (by Segment), 2018-2020 ........................................ 336 Figure 18.39: Meridian Bioscience: Revenue (by Region), 2018-2020 .......................................... 337 Figure 18.40: Meridian Bioscience: R&D Expenditure, 2018-2020 ................................................ 337 Figure 18.41: Meridian Bioscience: SWOT Analysis ...................................................................... 338 Figure 18.42: Macherey-Nagel GmbH & Co KG: Key Product Portfolio ......................................... 340 Figure 18.43: Macherey-Nagel GmbH & Co KG: SWOT Analysis ................................................. 341 Figure 18.44: New England Biolabs, Inc: Key Product Offerings ................................................... 343 Figure 18.45: New England Biolabs, Inc.: SWOT Analysis ............................................................ 344 Figure 18.46: Norgen Biotek Corp.: Key Product Portfolio ............................................................. 346 Figure 18.47: Norgen Biotek Corp.: SWOT Analysis ..................................................................... 347 Figure 18.48: Omega Bio-tek, Inc.: Key Product Portfolio .............................................................. 349 Figure 18.49: Omega Bio-Tek: SWOT Analysis ............................................................................. 350 All rights reserved at BIS Research 28
Global Nucleic Acid Isolation and Purification Market Figure 18.50: Orasure Technologies, Inc.: Key Product Portfolio................................................... 352 Figure 18.51: Orasure Technologies, Inc.: Overall Financials, 2018-2020 ..................................... 352 Figure 18.52: Orasure Technologies, Inc. Revenue (by Segment), 2018-2020 ............................. 353 Figure 18.53: Orasure Technologies, Inc.: Revenue (by Region), 2018-2020 ............................... 354 Figure 18.54: Orasure Technologies, Inc.: R&D Expenditure, 2018-2020 ..................................... 354 Figure 18.55: Orasure Technologies, Inc.: SWOT Analysis ........................................................... 355 Figure 18.56: PerkinElmer, Inc.: Key Product Portfolio .................................................................. 357 Figure 18.57: Perkin Elmer, Inc.: Overall Financials, (2018-2020) ................................................. 358 Figure 18.58: Perkin Elmer, Inc.: Revenue (by Business Segment), 2018-2020 ........................... 358 Figure 18.59: Perkin Elmer, Inc.: Revenue (by Region), 2018-2020 .............................................. 359 Figure 18.60: PerkinElmer, Inc.: R&D Expenditure, 2018-2020 ..................................................... 360 Figure 18.61: PerkinElmer, Inc.: SWOT Analysis ........................................................................... 361 Figure 18.62: Promega Corporation: Key Product Portfolio ........................................................... 363 Figure 18.63: Promega Corporation: SWOT Analysis ................................................................... 364 Figure 18.64: QIAGEN N.V.: Key Product Offerings ...................................................................... 366 Figure 18.65: QIAGEN N.V.: Overall Financials, 2018-2020 ......................................................... 367 Figure 18.66: QIAGEN N.V.: Revenue (by Segment), 2018-2020 ................................................. 368 Figure 18.67: QIAGEN N.V.: Revenue (by Region), 2016-2018 .................................................... 369 Figure 18.68: QIAGEN N.V.: R&D Expenditure, 2018-2020 .......................................................... 370 Figure 18.69: QIAGEN N.V.: SWOT Analysis ................................................................................ 371 Figure 18.70: Sage Science, Inc.: Key Product Portfolio ................................................................ 373 Figure 18.71: Sage Science, Inc.: SWOT Analysis ........................................................................ 374 Figure 18.72: Tecan Group: Key Product Portfolio ........................................................................ 376 Figure 18.73: Tecan Group: Overall Financials, 2018-2020........................................................... 376 Figure 18.74: Tecan Group Revenue (by Segment), 2018-2020 ................................................... 377 Figure 18.75: Tecan Group: Revenue (by Region), 2018-2020 ..................................................... 378 Figure 18.76: Tecan Group: R&D Expenditure, 2018-2020 ........................................................... 378 Figure 18.77: Tecan Group: SWOT Analysis ................................................................................. 379 Figure 18.78: Thermo Fisher Scientific Inc.: Key Product Offerings ............................................... 381 Figure 18.79: Thermo Fisher Scientific Inc.: Overall Financials, 2018-2020 .................................. 382 Figure 18.80: Thermo Fisher Scientific Inc: Sales (by Segment), $Million, 2018-2020 .................. 383 Figure 18.81: Thermo Fisher Scientific Inc.: Sales (by Region), 2018-2020 .................................. 384 All rights reserved at BIS Research 29
Global Nucleic Acid Isolation and Purification Market Figure 18.82: Thermo Fisher Scientific Inc.: R&D Expenditure, 2018-2020 ................................... 385 Figure 18.83: Thermo Fisher Scientific Inc.: SWOT Analysis ......................................................... 386 Figure 18.84: Zymo Research: Key Product Portfolio .................................................................... 388 Figure 18.85: Zymo Research: SWOT Analysis ............................................................................ 389 All rights reserved at BIS Research 30
Global Nucleic Acid Isolation and Purification Market BIS Research Offerings: BIS Research Offerings: We are on a mission to harness the potential of disruptive technologies to make businesses thrive in today’s digital age. We have a vision to be a leading and a preferred knowledge partner for corporates and institutions worldwide and assist them with market intelligence in the area of emerging technologies, advisories, and other innovative solutions. Know More Know More Know More Know More All rights reserved at BIS Research 31
Global Nucleic Acid Isolation and Purification Market Disclaimer Disclaimer BIS Research Inc. provides valuable market intelligence to an exclusive group of customers in response to orders. The report is licensed for the customer's internal use only and is subject to restrictions set henceforth. This document and its contents are confidential and may not be further distributed, published or reproduced, in whole or in part, by any medium or in any form for any purpose, without the written consent of BIS Research. The customer will not disclose the contents of the report, whether directly through any medium or indirectly through incorporation in a database, marketing list, report or otherwise, or use or permit the use of information to generate any statistical or other information that is or will be provided to third parties, or voluntarily produce information in legal proceedings. Market reports are based on expectations, estimates and projections as of the date such information is available. Any recommendation contained in this report may not be suitable for all investors or businesses. The market conclusions drawn are necessarily based upon a number of estimates and assumptions that, while considered reasonable by BIS Research as of the date of such statements, are inherently subject to market fluctuations and business, economic and competitive uncertainties and contingencies For more details regarding permission, please contact us: Email: sales@bisresearch.com Tel: +1 510 404 8135 All rights reserved at BIS Research 32