Nutrient Space Diagram: Water Quality Ratios and Environmental Impact Assessment
Explore the 90th percentile Redfield Ratios and Chl.a ratios in surface water, highlighting the carbon-Chl.a ratio and the science disconnect in the DPSIR framework. Learn about the role of science in environmental and fisheries regulation, and land development resource management strategies.

Nutrient Space Diagram: Water Quality Ratios and Environmental Impact Assessment
E N D
Presentation Transcript
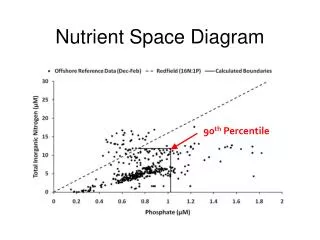
Nutrient Space Diagram 90th Percentile
Redfield Ratios (molar) 106 C : 15-16 N : 1 P Carbon: Chl a ratio (mass) Surface Water - 40 C : 1 Chl a Amalgamated Ratios 106 C : 15-16 N : 1 P : 0.036 Chl a Introducing Chl a
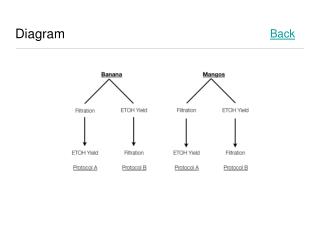
Costal TP vs Adjusted PO4 40:1 ratio showed best fit All points within 100% of 1:1 line Carbon : Chlorophyll a Ratio
The science disconnect in DPSIR Role of science DRIVERS PRESSURES STATE Social Change IMPACTS Environmental & fisheries regulation and enforcement, quotas RESPONSES Environment and Fisheries Planning, environmental assessment, regulation, guidelines, BPTs RESPONSES Land development Resource management