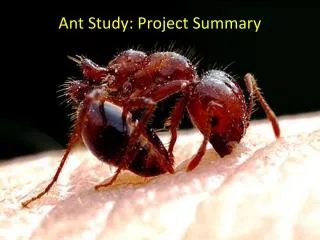
Study Design and Summary
This study presents observations of dust devil-like vortices in Sapporo, Japan, utilizing a three-dimensional scanning coherent Doppler lidar between April 2005 and July 2007. A total of 50 vortices were detected during daytime conditions when the atmospheric boundary layer was well-developed, particularly located at the vertices of convective cells. Key parameters such as core diameter, vorticity, and Doppler velocity were analyzed, revealing that over 60% of vortices were cyclonic. The data were compared with large eddy simulation models to enhance our understanding of ABL dynamics.

Study Design and Summary
E N D
Presentation Transcript
Study Design and Summary • Atmospheric boundary layer (ABL) observations were conducted in Sapporo, Japanfrom April 2005 to July 2007. • Three-dimensional scanning coherent Doppler lidar was utilized in this study. • 50 dust devil–like vortices were detected. • All dust-devil-like vortices occurred during the daytime after the ALB became well-developed. • Located at vertices or in the branches of convective cells. • ‘‘fishnet’’ patterns of wind field
Instrument & Study Area Summary • The 3D-CDL was installed on the roof of the Creative Research Institution of Hokkaido University, Sapporo, at a height of 28 m above ground level (AGL). • The area covered by the 3D-CDL contained tall buildings to the south and low residential buildings to the north (Fig. 1). • The 3D-CDL employed a transmitter operating at a wavelength of 1.54 mm with 0.5 millijoules per pulse at a PRF of 4 kHz. • The beam- width was 0.1 m, and the detection range was 0.4–4.4 km, with a 50-m radial resolution. • Aspatial resolution of 92 m at a range of 4.4 km • The PPI scanned with an elevation angle of 2.2°, while RHI scans were made along the predominant wind direction (north-northwesterly)
Detection of dust devil–like vortices • Doppler velocity data were excluded where SNR values were below a 4 dB threshold level. • To identify velocity measurements with low SNRs • Detection of dust devil-like vortices using the method presented by Suzuki et al. (2008): • 1) Calculated an absolute Doppler azimuthal shear from the Doppler velocity and estimated an azimuthal shear of > 3 x 10^-2 s^-1 • 2) Detected a pair of maximum and minimum Doppler velocities around the large azimuthal shear • 3) Fitted the pairs to the Rankine combined vortex model and calculated a correlation coefficient • 4) Selected vortices where correlation coefficients were >0.6. • The distance D between the maximum and minimum Doppler velocities was defined as the ‘deduced core diameter’ of a dust devil–like vortex. • Deduced vertical vorticity was estimated from 2ΔV/D
Large Eddy Simulation Model • Observational data from the Doppler lider were compared to a dry version of an LES model from Nakanishi (2000). • TKE was determined diagnostically • Simulated open convective cells (fishnets) and the parent circulations of dust devil-like vortices. • Momentum flux determined from the Monin-Obukhov similarity theory, with a roughness length of 0.38 m (from Sugawara 2001). • Open convective cells, the ABL height, and ABL stability were well simulated as compared to observed data (Figure 2).
Detection of dust devil–like vortices • Doppler velocity data were excluded where SNR values were below a 4 dB threshold level. • The deduced core diameters of the vortices ranged from 30 to 120 m, and maximum vorticity ranged from 0.15 to 0.26 s^-1 • These vortices occurred when the wind was relatively weak (<2.2 m/s) superadiabaticlapse rate of 1.1–2.0 x 10^-2 K/m • More than 60% of the vortices were cyclonic, and the rest were anticyclonic • Relatively strong dust devil–like vortices were detected only during the daytime (Table 1)and only after the ABL was well developed.
Detection of dust devil–like vortices • Figure 6 shows a sample of a Doppler velocity, a radial convergence field, and the strongest dust devil–like vortex (A) detected from a PPI scan at 0932:01 JST 25 May 2005. • The pattern of the Doppler velocity field (Fig. 6a) and the radial convergence (Fig. 6b) was a fishnet. • Vortex A was located at the vertex of the radial convergence, which is consistent with previous LES results (Kanak et al. 2000; Kanak 2005).
Detection of dust devil–like vortices • The Doppler velocity field around vortex A (Fig. 6e) and the distribution of its tangential velocity (Fig. 6f) had a structure that was similar to those of the Rankine combined vortex model. • The tangential component of the wind varied from -5.4 to +1.4 m/s. • The gray circle in Fig. 6e indicates the apparent core region based on the core diameter of the Doppler velocity signature. • The core diameter and the vertical vorticity of vortex A were estimated at 53 m and 0.26 s^1, respectively. • The SNR was weak in the vortex core (Fig. 6f) and was similar to the reflectivity structure of radar observations (Bluestein et al. 2004).
Evolution & structure of dust devil–like vortices • On 14 April 2005, the 3D-CDL performed three sec- tor PPI scans at elevation angles of 2.2, 4.4, and 6.6 degin a 90 deg arc toward the northwest. • Two relatively strong vortices were detected from the sector PPI scans over a 24-min period from 1330 to 1354 JST • For Vortex B the horizontal distributions of the Doppler velocity field and the radial convergence at 1335:54 JST corresponded to a fishnet pattern.
Evolution & structure of dust devil–like vortices • Vortex B was located at the wind convergence line (Fig. 7b), implying that it appeared within a convergence branch or at a vertex. • These observations are consistent with the simulations of Kanak et al. (2000) and Kanak (2005). • The three-dimensional structure of the Doppler velocity data clearly showed that vortex B extended to 200 m above the ground (Fig. 7c).
Evolution & structure of dust devil–like vortices • Figure 8 shows that the vortex developed vertically within a few minutes • Vorticityincreased with time in association with decreasing diameter • Therefore, vortex stretching in the updraft region of the fishnet would have intensified the vertical vorticity. • Aline of radial convergence detected by a single Doppler lidar corresponded to either a vertex or a branch of vertical velocity.
Summary • Fifty dust devil–like vortices were detected in Sapporo. • The diameters of the vortex cores and maximum vorticity ranged from 30 to 120 m and from 0.15 to 0.26 s^-1, respectively. • The vortices were detected only during the daytime and under relatively weak wind conditions (<2.2 m/s at 59.5 m AGL) with a deep boundary layer height (>650 m). • Their physical characteristics and conditions were similar to those observed over desert or flat areas. • Observed vortices appeared at vertices or in the branches of fishnets in the CBL in an urban area • Consistent with the results of the LES. • The observed vortices and convergence areas did not seem to be associated with particular topography or surface inhomogeneities. • Dust devil–like vortices initially formed along a low-level convergence line in a wind field with a fishnet structure and developed upward with time. • Vorticityincreased with a decrease in diameter, suggesting that vortex stretching might be responsible for intensifying the vertical vorticity.