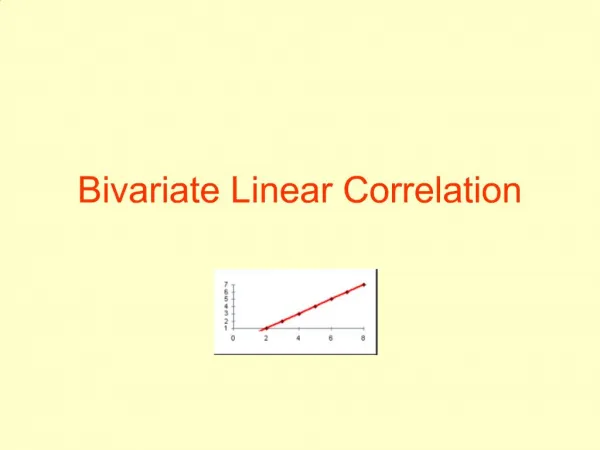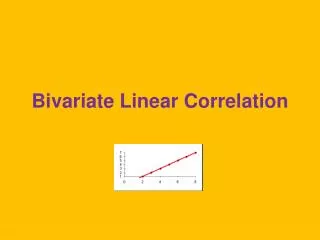
Correlation with a Non - Linear Emphasis
210 likes | 233 Views
Understand the complexities of correlation with a nonlinear emphasis. Learn to interpret scatterplots, residual patterns, and various regression shapes. Gain insights into lurking variables and causation pitfalls. Enhance your statistical analysis skills today!

Correlation with a Non - Linear Emphasis
E N D
Presentation Transcript
Correlation measures the strength of the linearassociation between 2 quantitative variables. • Before you use correlation, you must check several conditions:
Quantitative Variables Condition: Are both variables quantitative? • Straight Enough Condition: Is the form of the scatterplot straight enough that a linear relationship makes sense? If the relationship is not linear, the correlation will be misleading. • Outlier Condition: Outliers can distort the correlation dramatically. If an outlier is present it is often good to report the correlation with and without that point.
A hidden variable that stands behind a relationship and determines it by simultaneously affecting the other two variables is called a lurking (confounding) variable. • Scatterplots and correlation coefficients NEVER prove causation.
Don’t ever assume the relationship is linear just because the correlation coefficient is high. • In order to determine whether a relationship is linear or not linear, we must always look at the residual plot.
Residuals • A residualis the vertical distance between a data point and the graph of a regression equation.
The Residual is • positive if the data point is above the graph. • negative if the data point is below the graph. • Is 0 only when the graph passes through the data point.
What should you look for to tell if it is not linear?...... • Sometimes a high “r” value for linear regression is deceptive. You must look at the scatter plot AND you must look at the residual pattern it makes. • If the residuals have a curved pattern then it is NOT linear.
To prove linearity • A scatterplot of the residuals vs. the x-values should be the most boring scatterplot you’ve ever seen. • It shouldn’t have any interesting features, like a direction or a shape. • It should stretch horizontally, with about the same amount of scatter throughout. • It should show no bends. • It should show no outliers.
Some Non Linear Regression Shapes…… • Positive Quadratic Regression: • Negative Quadratic Regression:
More Non Linear Regression Shapes…… • Positive Exponential Regression: • Negative Exponential Regression:
Quadratic and Exponential on GDC…… • Quadratic: • Exponential:
Example……The scatter plot could possibly be linear. You must check the residual pattern.
Change y-list to resid after running a linear correlation regression – 2nd stat resid: • Notice the curved pattern in the residuals.
NOTE!!!!!! • Just because the curved pattern on the residuals looks like a quadratic we cannot determine that until we check the “r” value of other curved functions and see how well the data fits. • You should also consider “real-life” implications when deciding.
When you see that the residuals are curved you must check the correlation coefficient for the exponential and the quadratic to choose the stronger correlation. • A check on the exponential regression yield an r – value of -0.956. (Strong Negative but check out the quadratic….)
This is a quadratic regression….. • Equation: y=.00946x² - 0.839x+18.5 r = 0.966 This value is even stronger than the exponential.
Look at the residuals…… • There is a curved pattern in the residuals. It is NOT linear – it is either quadratic or exponential. (Positive) • Use the “r” value to help you decide.
And the Winner is….. • Here is the equation you should use for predictions: y = 1(2) x
Homework • Follow the flowchart.