Download
1 / 45
450 likes | 627 Views
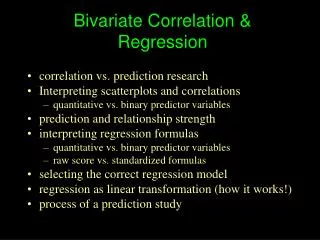
Bivariate Linear Correlation. Linear Function. Y = a + bX. Fixed and Random Variables. A FIXED variable is one for which you have every possible value of interest in your sample. Example: Subject sex, female or male.

E N D
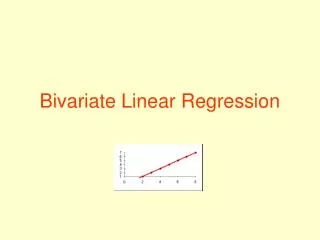
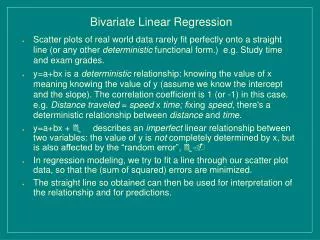
Linear Function Y = a + bX
Fixed and Random Variables • A FIXED variable is one for which you have every possible value of interest in your sample. • Example: Subject sex, female or male. • A RANDOM variable is one where the sample values are randomly obtained from the population of values. • Example: Height of subject.
Correlation & Regression • If Y is random and X is fixed, the model is a regression model. • If both Y and X are random, the model is a correlation model. • Psychologists generally do not know this • They think • Correlation = compute the corr coeff, r • Regression = find an equation to predict Y from X
For the data plotted below, the linear r = 0, but the quadratic r = 1.
Hø: ρ = 0 • df = n – 2 = 3 • Now get an exact p value and construct a confidence interval
Get Exact p Value • COMPUTE p=2*CDF.T(t,df).
Go To Vassar • http://vassarstats.net/
Presenting the Results • The correlation between my friends’ burger consumption and their beer consumption fell short of statistical significance, r(n = 5) = .8, p = .10,95% CI [-.28, .99]. • Among my friends, beer consumption was positively, significantly related to burger consumption, r(n = 10) = .8, p = .006,95% CI [.34, .95].
Assumptions • Homoscedasticity across Y|X • Normality of Y|X • Normality of Y ignoring X • Homoscedasticity across X|Y • Normality of X|Y • Normality of X ignoring Y • The first three should look familiar, we made them with the pooled variances t.
When Do Assumptions Apply? • Only when employing t or F. • That is, obtaining a p value • or constructing a confidence interval.
Shrunken r2 • This reduces the bias in estimation of • As sample size increases (n-1)/(n-2) approaches 1, and the amount of correction is reduced.
Do not use Pearson r if the relationship is not linear. If it is monotonic, use Spearman rho.
Every time X increases, Y decreases – accordingly we have here a perfect, negative, monotonic relationship
Pearson r measures the strength of the linear relationship. Notice that it is NOT perfect here.
Spearman rho measures the strength of monotonic relationship. Notice that it IS perfect here.
Uses of Correlation Analysis • Measure the degree of linear association • Correlation does imply causation • Necessary but not sufficient • Third variable problems • Reliability • Validity • Independent Samples t – point biserial r • Y = a + b Group (Group is 0 or 1)
Uses of Correlation Analysis • Contingency tables -- Rows = a + bColumns • Multiple correlation/regression
Uses of Correlation Analysis • Analysis of variance (ANOVA) • PolitConserv = a + b1 Republican? + b2Democrat? k = 3, the third group is all others • Canonical correlation/regression
Uses of Correlation Analysis • Canonical correlation/regression • (homophobia, homo-aggression) = (psychopathic deviance, masculinity, hypomania, clinical defensiveness) • High homonegativity = hypomanic, unusually frank, stereotypically masculine, psychopathically deviant (antisocial)
Factors Affecting Size of r • Range restrictions • Without variance there can’t be covariance • Extraneous variance • The more things affecting Y (other then X), the smaller the r. • Interactions – the relationship between X and Y is modified by Z • If not included in the model, reduces the r.
Cohen’s Guidelines • .10 – small but not trivial • .30 – medium • .50 – large
PSYC 6430 Addendum • The remaining slides cover material I do not typically cover in the undergraduate course.
Correcting for Measurement Error • If reliability is not 1, the r will underestimate the correlation between the latent variables. • We can estimate the correlation between the true scores this way: • rxx and rYY are reliabilities
Example • r between misanthropy and support for animal rights = .36 among persons with an idealistic ethical ideology
H: 1 = 2 • Is the correlation between X and Y the same in one population as in another? • The correlation between misanthropy and support for animal rights was significantly greater in nonidealists (r = .36) than in idealists (r = .02)
H: WX = WY • We have data on three variables. Does the correlation between X and W differ from that between Y and W. • W is GPA, X is SATverbal, Y is SATmath. • See Williams’ procedure in our text. • See other procedures referenced in my handout.
H: WX= YZ • Raghunathan, T. E, Rosenthal, R, & and Rubin, D. B. (1996). Comparing correlated but nonoverlapping correlations, Psychological Methods, 1, 178-183. • Example: is the correlation between verbal aptitiude and math aptitude the same at 10 years of age as at twenty years of age (longitudional data)
H: = nonzero value • A meta-analysis shows that the correlation between X and Y averages .39. • You suspect it is not .39 in the population in which you are interested. • H: = .39.