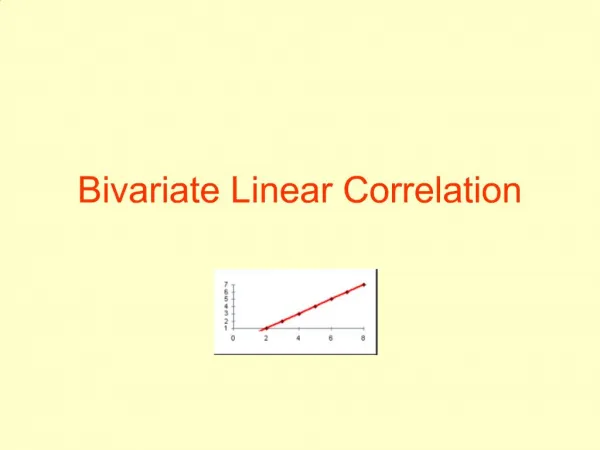
Linear Correlation
Linear Correlation. When Simultaneous observations on hydrological variables are available then one may be interested in the linear association between the variables. This is expressed by the co variance and correlation coefficient.

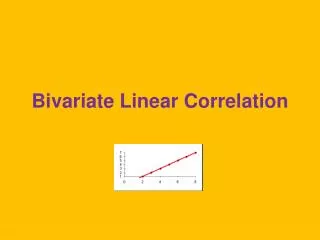
Linear Correlation
E N D
Presentation Transcript
Linear Correlation When Simultaneous observations on hydrological variables are available then one may be interested in the linear association between the variables. This is expressed by the co variance and correlation coefficient. If there are N pairs of observations (x1,y1),(x2,y2)………(xn,yn) of two variables the sample co variance is obtained from the following expressions.
Measure of linear association • Covariance: • Correlation coefficient:
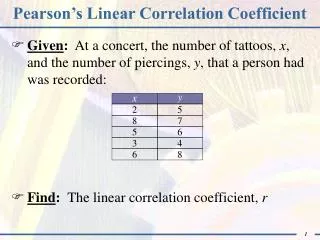
Cxy – Co variance mx, my – Sample means of X ,Y respectively. sx,sy= sample standard deviations of X and Y To get the limits of Γxy considering the case when X and Y have a perfect linear correlation.Then the relationship between X and Y , Y=a+bX
Correlation range • Linear relation: Y = a + b.X • Hence: mY = a + b.mX and: sY2 = b2.sX2 or: sY = |b|sX So: it follows: -1 rXY 1
If Y increases with increasing X, I.e. they are positively correlated, then b>o and rxy = 1 If Y decreases with increasing X they are negatively correlated, b<0, rxy = -1 If there is no linear correlation between X and Y then rxy=0. It does not mean that X And Y are independent or there is no association between X and Y. A convenient means to investigate the existence of linear association is making a XY scatter plot of the samples.
Scatter plots strong linear, no, spurious, and circular correlation
Spurious Correlation If Dry and Wet period discharges of two distant sites in two different regions are plotted then the correlation will exist but that will not be the true correlation. This effect is due to acceptance of heterogeneous data.
Spurious correlation (1) • Spurious correlation due to heterogeneous data or clustering of data: • combining non-monsoon and monsoon data • series X and Y in each period fully uncorrelated • means mX and mY fall between non-monsoon and monsoon mean • sign of (x - mX)(y - mY) always positive for non-monsoon and monsoon period • strong correlation seems to be available, but predictive value in either monsoon or non-monsoon period is nil
Spurious correlation (2)Wrong conclusions can be drawn by comparing data having the same denominator. • X, Y and Z are uncorrelated • spurious correlation, the plot of X/Z versus Y/Z will show non-zero correlation • For equal Cv’s r = 0.5!! • Spurious correlation arises, when: • dimensionless terms are used, or • standardised variables are used