Download
1 / 19
190 likes | 378 Views
Communicating Uncertainty. Good vs Bad James McPherson 21 st June 2012. What Actuaries say. There is process risk, parameter risk, model risk and output variability. What people hear. There is blah, blah, blah. There is parameter risk, model risk and output variability. ROC example.

E N D
Communicating Uncertainty Good vs Bad James McPherson 21st June 2012
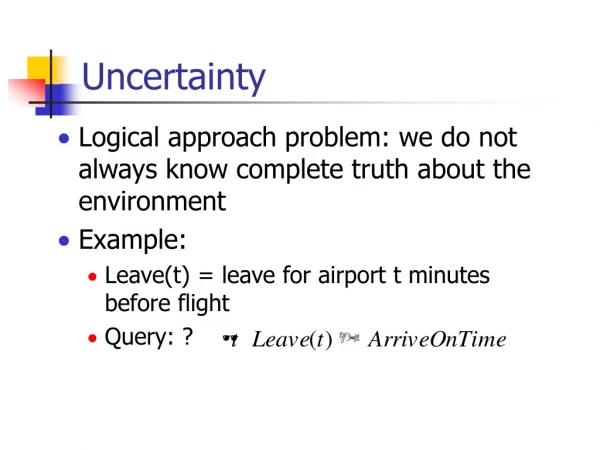
What Actuaries say There is process risk, parameter risk, model risk and output variability
What people hear There is blah, blah, blah There is parameter risk, model risk and output variability
ROC example “The best estimate reserve is my estimate of the expected value of future claims. However, there is considerable uncertainty in the eventual outcome of claim payments, and future claim payments could be more or less, possibly significantly so, than the best estimate. Estimating this uncertainty is a judgemental process, but in my view there is a reasonable chance that claim payments will exceed £Am, but unlikely that the outcome will exceed £Bm. [A and B are estimated 75% and 90% percentiles respectively] Some of the key features which contribute to this uncertainty are: (1) the XYZ legal dispute, which could cost up to £C1 million or produce savings of £C2 million; (2) normal volatility in payments experienced in the past. If this repeats in the future, it is possible (but unlikely) that claims will be greater by £Dm or more; [90 percentile for this component of volatility]; and (3) uncertainty on the impact on reserves of the change in underwriting strategy in 2004 and 2005. This could increase reserves by £E million or reduce them by £F million. Overall I believe it likely that the outturn for total claim payments will lie in the range £Gm to £Hm. [90% confidence interval]” Quantification and Reporting of Uncertainty for GI Reserving – ROC Giro 2007
ROC again – Now rarely used? Quantification and Reporting of Uncertainty for GI Reserving – ROC Giro 2007
ABI Research Paper No 25HELPING CONSUMERS UNDERSTAND INVESTMENT RISK • Introducing a pictorial presentation of investment risk is more effective than a purely text based description. Pictorial presentations can improve people’s ability to pick the right fund by over 20% relative to a purely text based version. • • Standardising the disclosure of investment risk helps. People who see the same presentation of risk for all the investment funds are on average 16% more likely to pick the right fund than those who see a different presentation of risk for each of the funds. • • The form of standardisation also matters. The top three pictorial designs are roughly twice as effective as the three worst designs. • • The most effective pictorial design is a horizon thermometer. There are two thermometers that do particularly well, one of which is the thermometer design proposed by CESR in its consultation of risk disclosure for the Key Information Document for UCITS. • • Although consumers often comment that they would prefer to see more charts, introducing charts can reduce their ability to understand the information. Using bar charts, instead of a table, to present relative investment performance and the probability of losing money, reduces people’s ability to answer questions by between 50-75%. • • Although the fan chart design is associated with a higher number of participants in the top group for the suitability task, overall it does not lead to an improvement in performance.
Other • Martin Lunnon (Oct 2008) chief actuary, Social security and overseas pensions, Government Actuary’s DepartmentCentral Estimate – then alternatives • Derek Newton (Nov 2011) – Process Risk, Parameter Risk, Model Risk, Future Systemic Risk
An inconvenient uncertainty“What would I want?” – From David Ibeson CEO, Giro 2007 • Tell me what I need to hear not what you think I want to hear. • Take a step back and try and look at the analysis top down rather than bottom up. • Act as if you are part of the team! Be prepared to tell me what you would do. • Make sure that you know the relevance/context. • Be prepared to push back if you think I haven’t fully understood.
An inconvenient uncertainty“Summary” – From David Ibeson CEO, Giro 2007 • The limit of an actuary’s ability to contribute is directly proportional to his ability to communicate. • This should not be a limiting factor!
Communicating badly – Slide 1 of 3 “Reserving is fundamentally uncertain.” “I set out below the limitations and uncertainties of our work” – 45 paragraphs follow, mostly standard.
A – The expected value (“best estimate”) of the company’s liabilities. B – The probability density function for the company’s liabilities. D – The range of possible outcomes. Increasing probability B B B A A A £0m £100m £200m D Reserve Estimates Communicating badly – Slide 2 of 3
C – The range of reasonable best estimates D – The range of possible outcomes Increasing probability £0m £100m £200m C D Reserve Estimate Communicating badly – Slide 3 of 3
2 Categories of Uncertainty • Variability Range of Possible Outcomes • Casual explanation based on expert judgement • Quantitative methods • Verification • £100m deficit really? Guess / Professional Judgement / Rigorous Analysis with Robust Evidence • Range of Reasonable Best Estimate
TAS R • “An aggregate report shall indicate the nature and extent of any material uncertainty in the information it contains.” • Uncertainty may concern the results of the calculations, assumptions on which information is based or other aspects. It may arise from random variations, lack of information or other sources. The extent of any material uncertainty may itself be subject to uncertainty. • There are many ways of indicating the extent of uncertainty, such as: • Giving a range, measure of the value at risk or other statistical calculation; • Showing the numerical consequences of change in assumptions; • Presenting the outcomes of scenarios, possibly including extreme scenarios; and • Describing the uncertainty and explaining why it has not been quantified
TAS R • “An aggregate report shall indicate the nature and extent of any material uncertainty in the information it contains.” • Uncertainty may concern the results of the calculations, assumptions on which information is based or other aspects. It may arise from random variations, lack of information or other sources. The extent of any material uncertainty may itself be subject to uncertainty. • There are many ways of indicating the extent of uncertainty, such as: • Giving a range, measure of the value at risk or other statistical calculation; • Showing the numerical consequences of change in assumptions; • Presenting the outcomes of scenarios, possibly including extreme scenarios; and • Describing the uncertainty and explaining why it has not been quantified Variability
TAS R • “An aggregate report shall indicate the nature and extent of any material uncertainty in the information it contains.” • Uncertainty may concern the results of the calculations, assumptions on which information is based or other aspects. It may arise from random variations, lack of information or other sources. The extent of any material uncertainty may itself be subject to uncertainty. • There are many ways of indicating the extent of uncertainty, such as: • Giving a range, measure of the value at risk or other statistical calculation; • Showing the numerical consequences of change in assumptions; • Presenting the outcomes of scenarios, possibly including extreme scenarios; and • Describing the uncertainty and explaining why it has not been quantified Verification
Derek Newton - Questions What do you want to say? •To whom do you want to say it? •What do the stakeholders want / expect to hear? •What do the stakeholders already know? •How will the stakeholders use your advice? •By what means is communication with them most effective? Then.... •Explain that there is uncertainty •Explain its nature and causes •Explain its magnitude
-1 Our scope and process Our scope and process
Are these Hurricane Forecasts Accurate? Figure 2. Mean absolute error for the May and August NOAA seasonal hurricane forecasts (1999 - 2009 for May, 1998 - 2009 for August), and for forecasts made using climatology from the past five years. A forecast made using climatology was in error, on average, by 3.6 named storms, 2.5 hurricanes, and 1.7 intense hurricanes. NOAA's May forecast was not significantly better than climatology for these quantities, with average errors of 3.5 named storms, 2.3 hurricanes, and 1.4 intense hurricanes. Only NOAA's May ACE forecast was significantly better than climatology, averaging 58 ACE units off, compared to the 74 for climatology. Image credit: Verification of 12 years of NOAA seasonal hurricane forecasts, National Hurricane Center.